

Question: ivers Comparative Balance Sheet December 31, 2011, and 2010 2011 2010 Assets Current assets Cash Accounts Receivable Inventory Prepaid expenses $28,000 $ 48,600 226,900 203,800
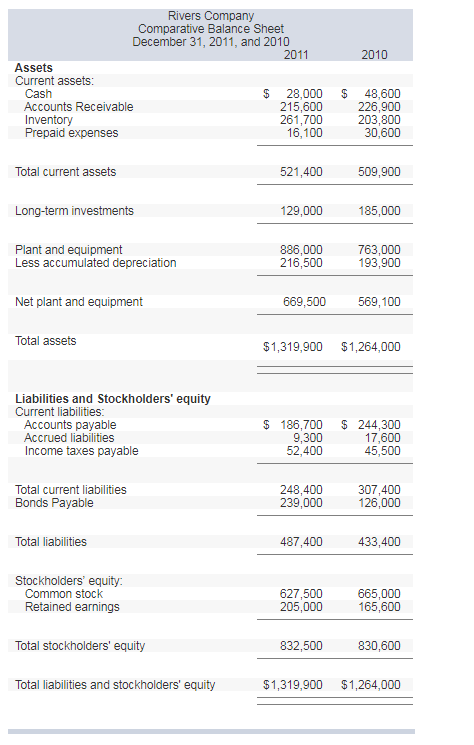
ivers Comparative Balance Sheet December 31, 2011, and 2010 2011 2010 Assets Current assets Cash Accounts Receivable Inventory Prepaid expenses $28,000 $ 48,600 226,900 203,800 30,600 215,600 261,700 16,100 521,400 129,000 886,000 Total current assets 509,900 Long-term investments 185,000 Plant and equipment Less accumulated depreciation 763,000 193,900 216,500 Net plant and equipment 669,500 569,100 Total assets $1,319,900 $1,264,000 Liabilities and Stockholders' equity Current liabilities Accounts payable Accrued liabilities Income taxes payable $ 186,700 244,300 17,600 45,500 9,300 52,400 Total current liabilities Bonds Payable 248,400 239,000 307,400 126,000 Total liabilities 487,400 433,400 Stockholders' equity: Common stock Retained earnings 627,500 205,000 665,000 165,600 Total stockholders' equity 832,500 830,600 Total liabilities and stockholders' equity $1,319,900 $1,264,000
Step by Step Solution
There are 3 Steps involved in it

Get step-by-step solutions from verified subject matter experts