

Question: j 1. Use MATLAB to create a histogram and boxplot of the data to show how data are distributed. 2. Use MS Word to create
 j
j
1. Use MATLAB to create a histogram and boxplot of the data to show how data are distributed.
2. Use MS Word to create a table of descriptive statistics using the mean standard deviation, %CV, and median and IQR. The table should be well organized with a DESCRIPTIVE table title in the CORRECT position.
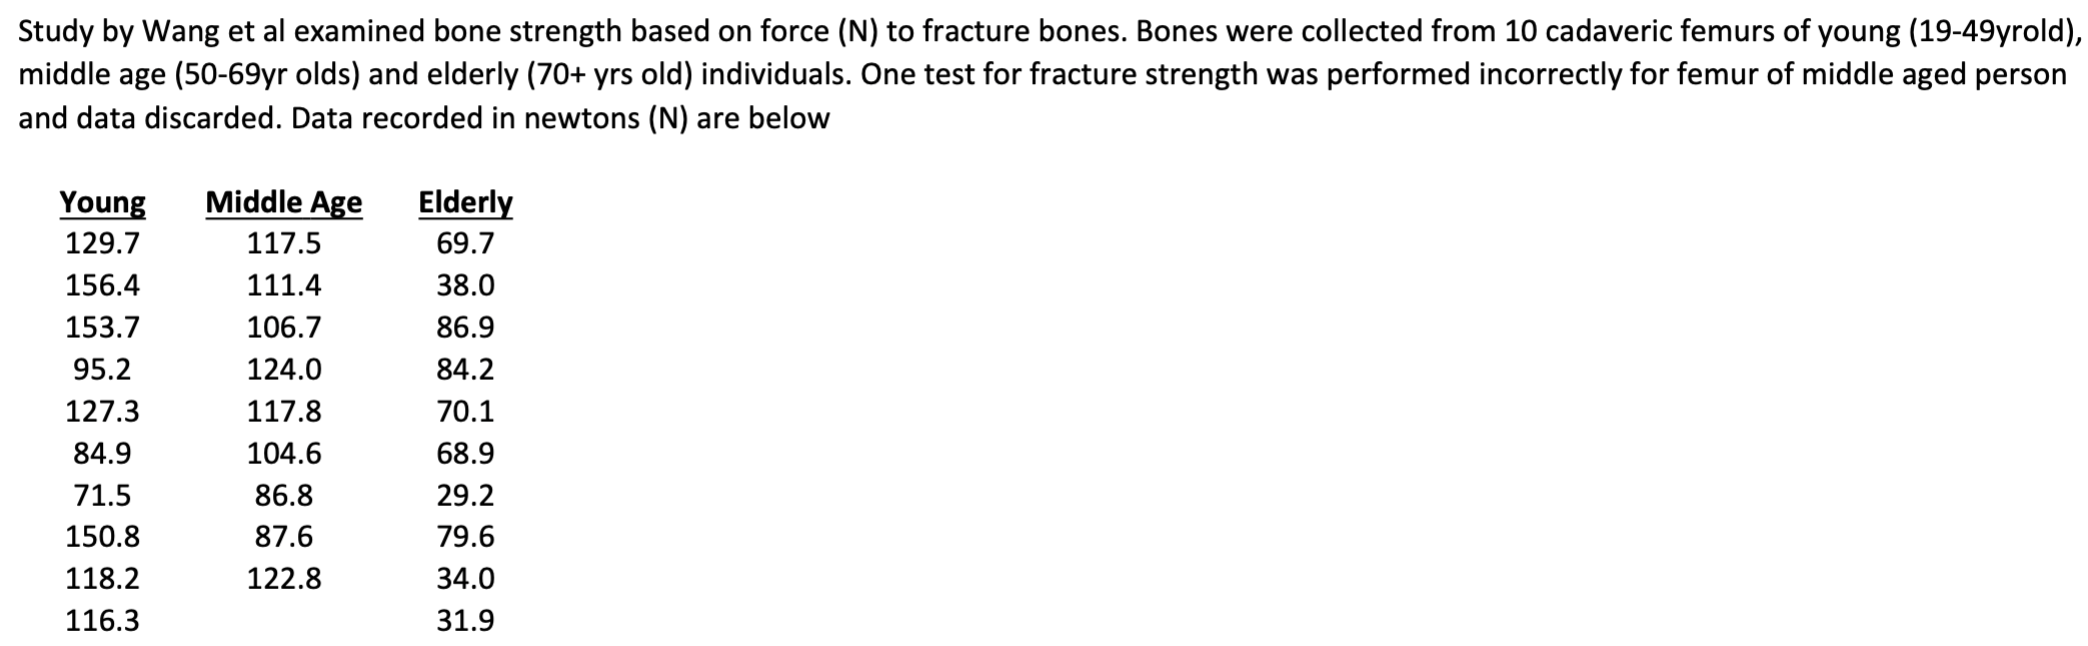
Study by Wang et al examined bone strength based on force (N) to fracture bones. Bones were collected from 10 cadaveric femurs of young (19-49yrold), middle age (50-69yr olds) and elderly (70+ yrs old) individuals. One test for fracture strength was performed incorrectly for femur of middle aged person and data discarded. Data recorded in newtons ( N ) are below
Step by Step Solution
There are 3 Steps involved in it

Get step-by-step solutions from verified subject matter experts