

Question: J 2 A. For GameStop, list out the key regression statistics (alpha, beta and R squared) in the regression. Do you notice any patterns? Can
J 2
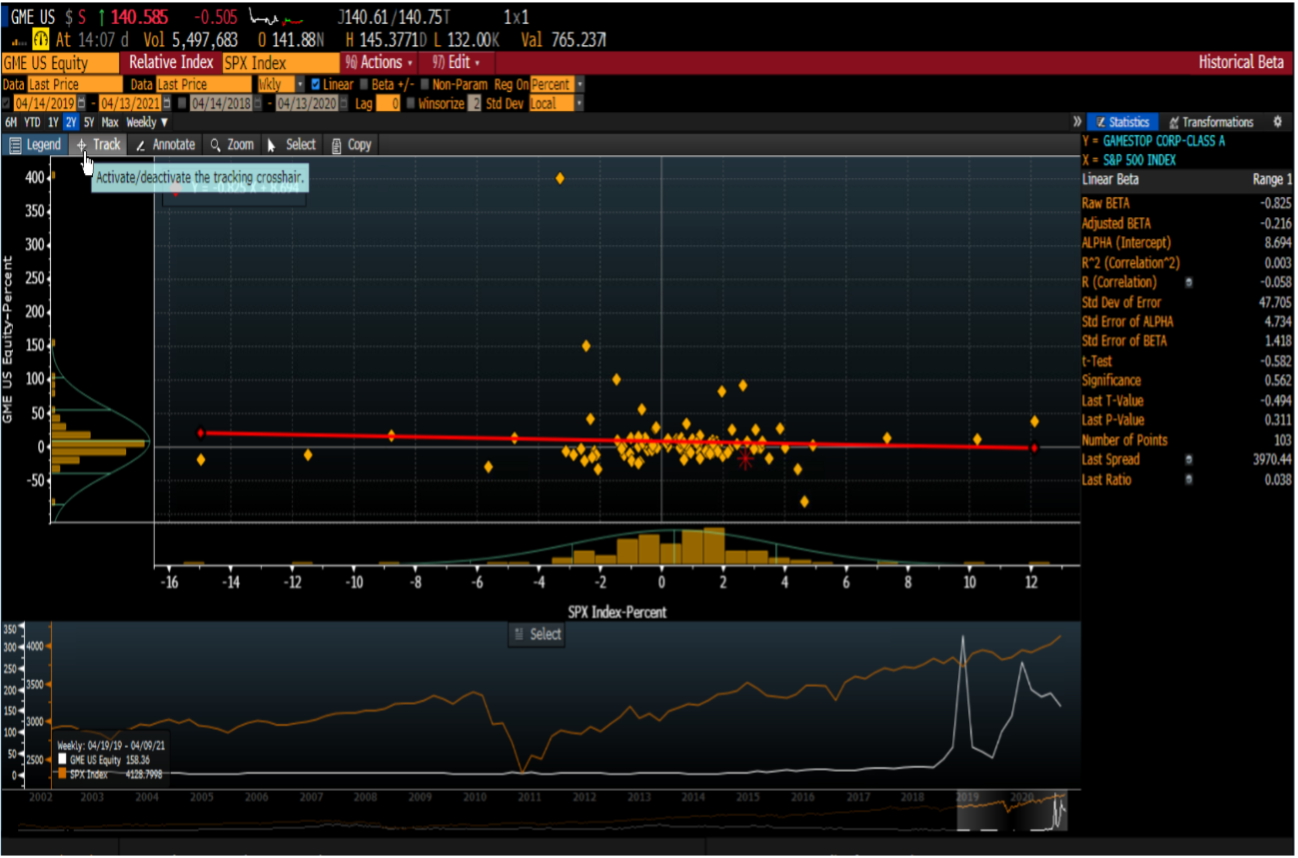
A. For GameStop, list out the key regression statistics (alpha, beta and R squared) in the regression. Do you notice any patterns? Can you interpret beta and R2 of the regression?
B. During the period of the regression, GameStop had incredible volatility but its beta does not seem to reflect it. Explain why.
Step by Step Solution
There are 3 Steps involved in it
1 Expert Approved Answer
Step: 1 Unlock

Question Has Been Solved by an Expert!
Get step-by-step solutions from verified subject matter experts
Step: 2 Unlock
Step: 3 Unlock