

Question: J. Gringauz Project2 LAB4: Simulated Cold Data Sampling Distribution of phat PART3 Name_ colds 40 classes n-32 95 Rel freq 02 0.3 0.4 0.5
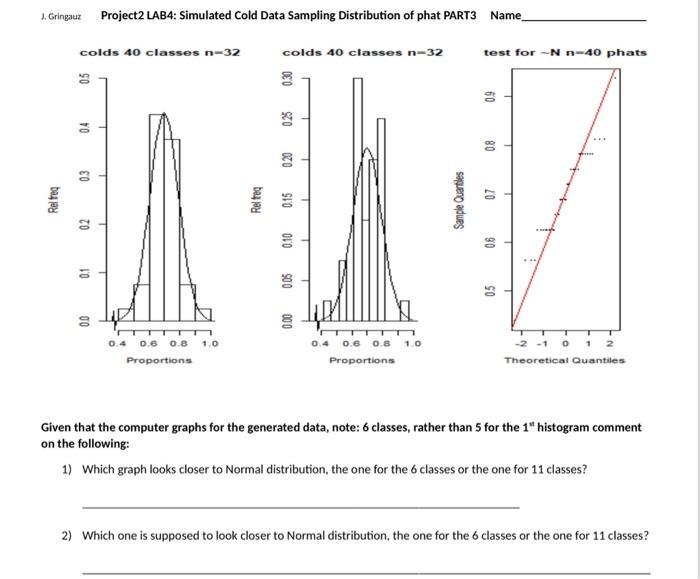
J. Gringauz Project2 LAB4: Simulated Cold Data Sampling Distribution of phat PART3 Name_ colds 40 classes n-32 95 Rel freq 02 0.3 0.4 0.5 10 00 0.0 0.4 0.6 0.8 1.0 Proportions colds 40 classes n-32 test for -N n-40 phats 0 60 60 20 Rel freq 0.10 0.15 0.20 0.25 900 90 000 0.4 0.6 0.8 1.0 Proportions Sample Quartiles 05 0.6 07 0.8 T -2-10 12 Theoretical Quantiles Given that the computer graphs for the generated data, note: 6 classes, rather than 5 for the 1" histogram comment on the following: 1) Which graph looks closer to Normal distribution, the one for the 6 classes or the one for 11 classes? 2) Which one is supposed to look closer to Normal distribution, the one for the 6 classes or the one for 11 classes?
Step by Step Solution
There are 3 Steps involved in it

Get step-by-step solutions from verified subject matter experts