

Question: J |_ Section A | Note: Am: ail questions. Each question carries 5 marks. 1. Locate median and mode graphically for the following data: Class:
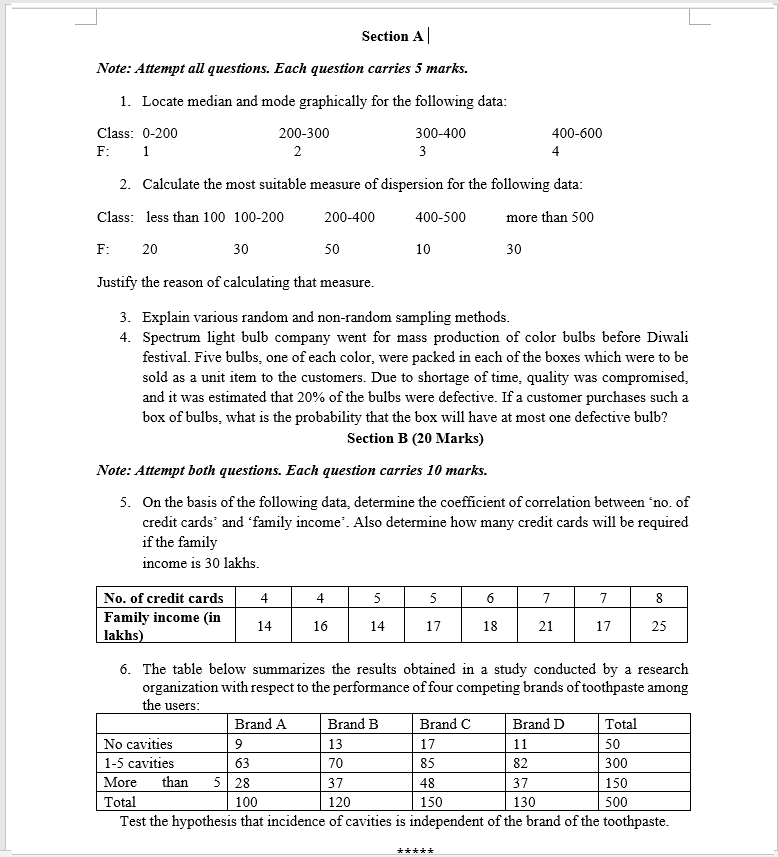
J |_ Section A | Note: Am: ail questions. Each question carries 5 marks. 1. Locate median and mode graphically for the following data: Class: [ItEDD 2003 El 3004130 4006043 F: l 2 3 4 2. Calculate the most suitable measure of dispersion for the following data: Class: less than 1011] IUDEDD 200400 4005130 more than SDI} F: 20 30 50 ID 30 Justify the reason of calculating that measure. 3. Explain various random and nonrandom sampling methods. 4. Spectrum light bulb company went for mass production of color bulbs before Diwali festival. Five bulbs, one of each color, were packed in each of the boxes which were to be sold as a unit item to the customers. Due to shortage of time, quality was compromised, and it was estimated that 2% of the bulbs were defective. Ifa customer purchases such a box of bulbs, what is the probability that the box will have at most one defective bulb? Section B {2.0 Marks] Note: Am: both questions. Each question carries It? marks. 5. On the basis of the following data, determine the coefficient of correlation between 'no. of credit cards\" and 'family mcome=. Also determine how many credit cards will be required if the family income is 3:] lakhs. mnnnn MW\" lakhs 6. The table below summarizes the results obtained in a study conducted by a research organization with respect to the performance of four competing brands of toothpaste among the users: _ um um Test the hypothesis that incidence of cavities is independent of the brand of the toothpaste. iii-ii
Step by Step Solution
There are 3 Steps involved in it

Get step-by-step solutions from verified subject matter experts