

Question: Complete the following: 1. Open the workbook named Raider.xlsx and save the file as Raider Analysis (Last Name).xlsx. 2. Create a series of charts
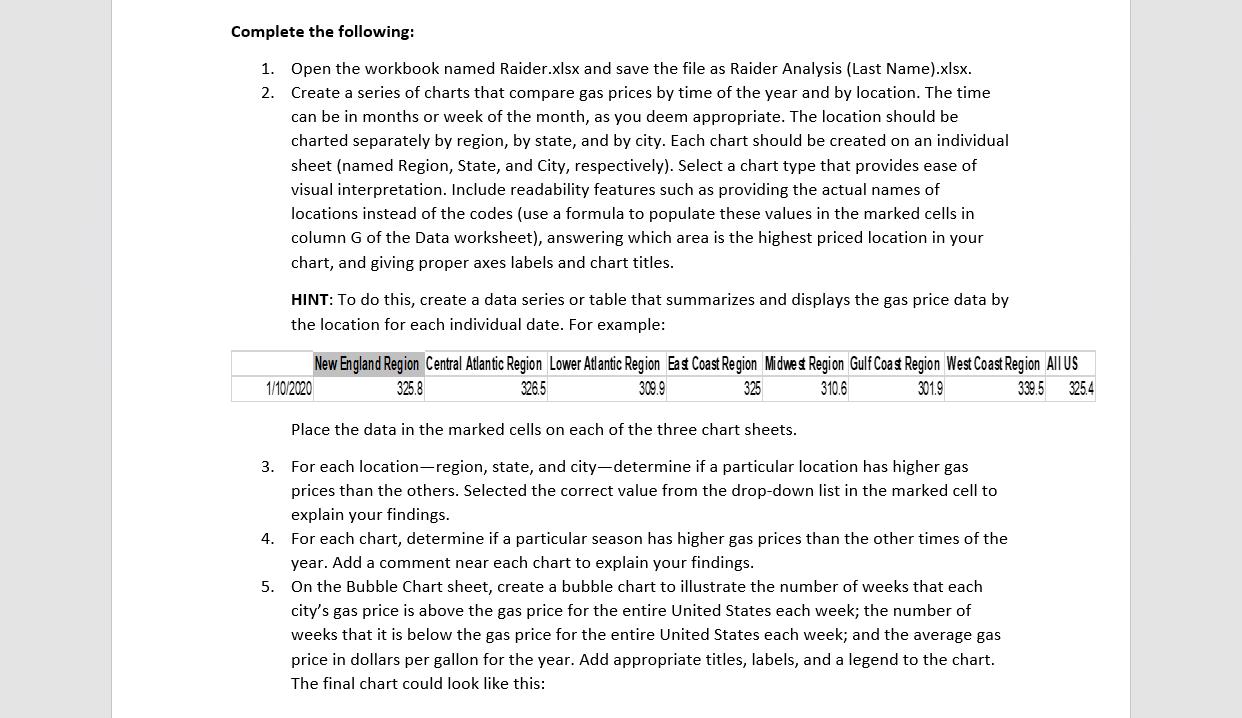
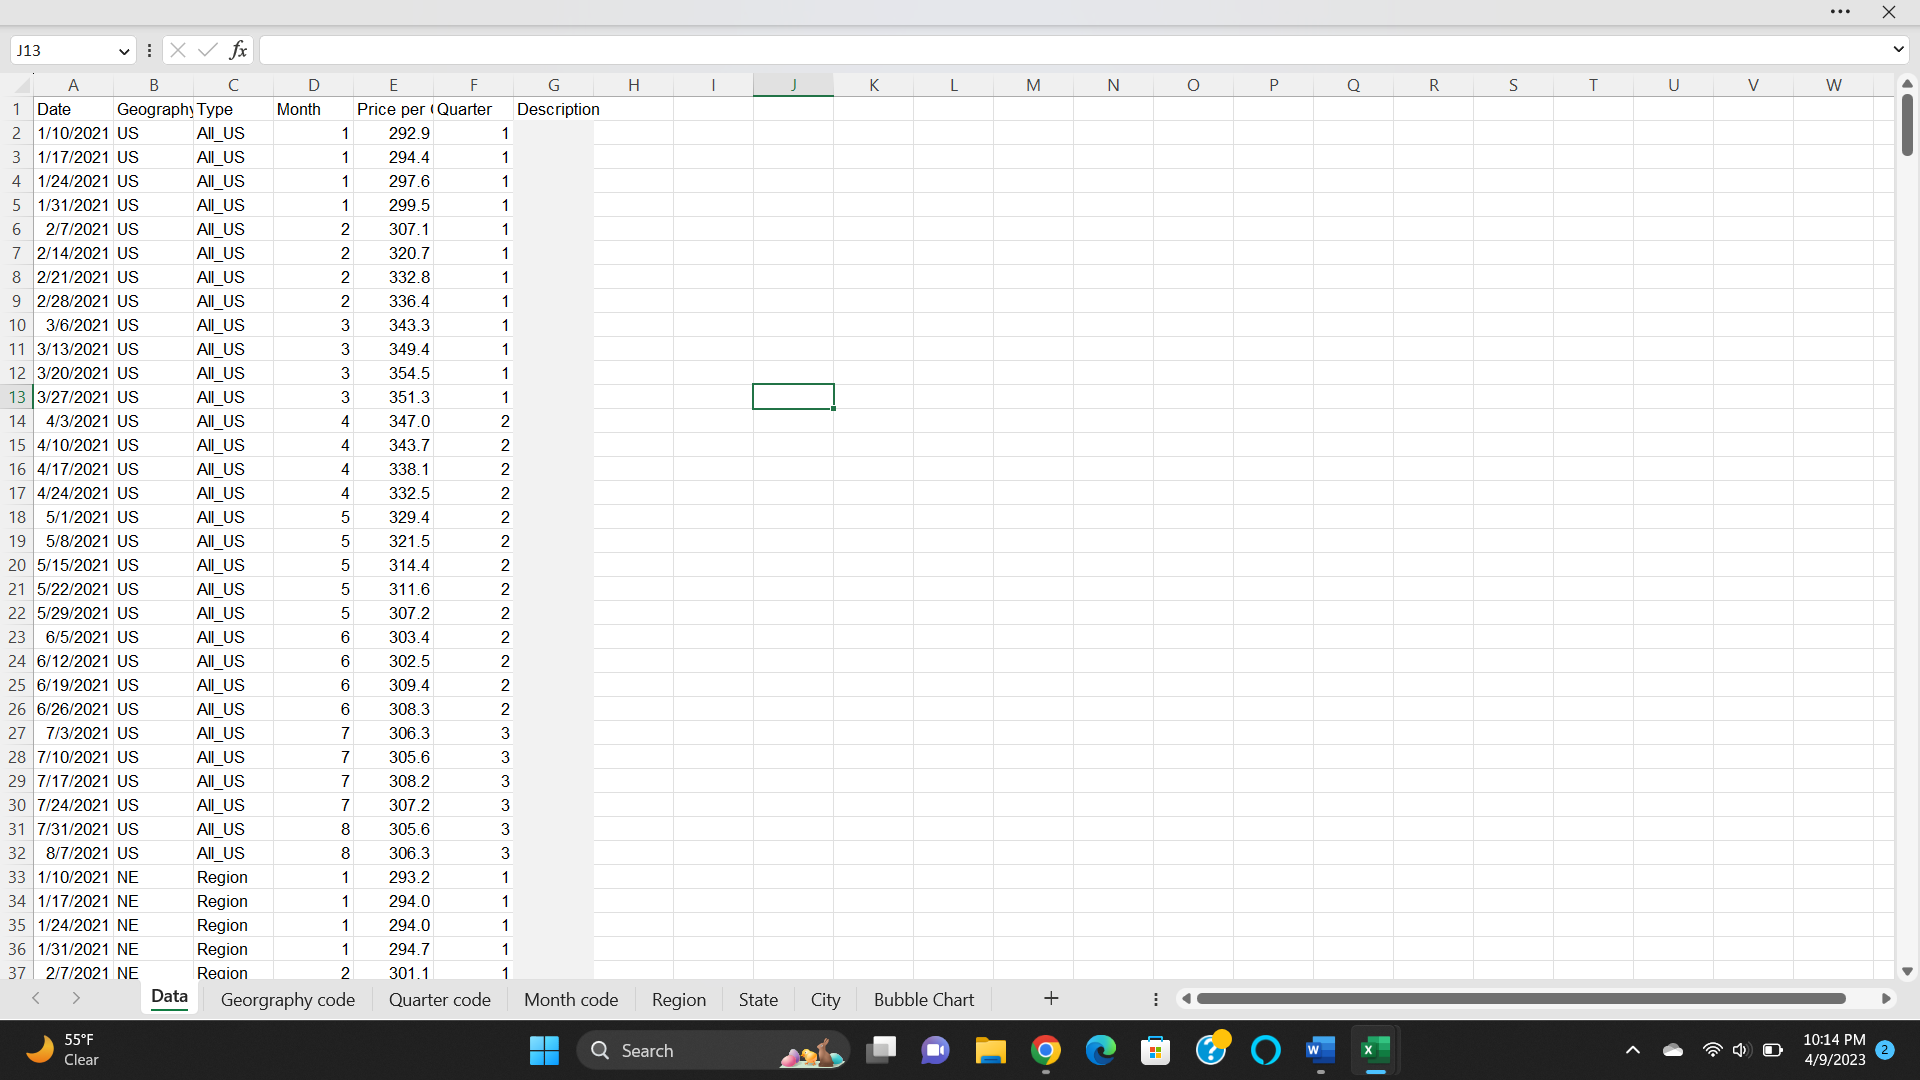
Complete the following: 1. Open the workbook named Raider.xlsx and save the file as Raider Analysis (Last Name).xlsx. 2. Create a series of charts that compare gas prices by time of the year and by location. The time can be in months or week of the month, as you deem appropriate. The location should be charted separately by region, by state, and by city. Each chart should be created on an individual sheet (named Region, State, and City, respectively). Select a chart type that provides ease of visual interpretation. Include readability features such as providing the actual names of locations instead of the codes (use a formula to populate these values in the marked cells in column G of the Data worksheet), answering which area is the highest priced location in your chart, and giving proper axes labels and chart titles. HINT: To do this, create a data series or table that summarizes and displays the gas price data by the location for each individual date. For example: New England Region Central Adantic Region Lower Adantic Region East Coast Region Midwest Region Gulf Coast Region West Coast Region All US 1/10/2020 309.9 325 325.8 326.5 Place the data in the marked cells on each of the three chart sheets. 310.6 301.9 3. For each location-region, state, and city-determine if a particular location has higher gas prices than the others. Selected the correct value from the drop-down list in the marked cell to explain your findings. 4. For each chart, determine if a particular season has higher gas prices than the other times of the year. Add a comment near each chart to explain your findings. 5. On the Bubble Chart sheet, create a bubble chart to illustrate the number of weeks that each city's gas price is above the gas price for the entire United States each week; the number of weeks that it is below the gas price for the entire United States each week; and the average gas price in dollars per gallon for the year. Add appropriate titles, labels, and a legend to the chart. The final chart could look like this: 3395 3254 J13 fx A B C D E F G H K L M N O P R S T U V W 1 Date Geography Type Month Price per (Quarter Description 2 1/10/2021 US All_US 1 292.9 1 3 1/17/2021 US All_US 1 294.4 1 4 1/24/2021 US All_US 1 297.6 1 5 1/31/2021 US All_US 1 299.5 1 6 2/7/2021 US All_US 2 307.1 1 7 2/14/2021 US All_US 2 320.7 1 8 2/21/2021 US All_US 2 332.8 1 9 2/28/2021 US All_US 2 336.4 1 10 3/6/2021 US All_US 3 343.3 1 11 3/13/2021 US All_US 3 349.4 1 12 3/20/2021 US All_US 3 354.5 1 13 3/27/2021 US All_US 3 351.3 1 14 4/3/2021 US All_US 4 347.0 2 15 4/10/2021 US All_US 4 343.7 2 16 4/17/2021 US All_US 4 338.1 2 17 4/24/2021 US All_US 4 332.5 2 18 5/1/2021 US All_US 5 329.4 2 19 5/8/2021 US All_US 5 321.5 2 20 5/15/2021 US All_US 5 314.4 2 21 5/22/2021 US All_US 5 311.6 2 22 5/29/2021 US All_US 5 307.2 2 23 6/5/2021 US All_US 6 303.4 2 24 6/12/2021 US All_US 6 302.5 2 25 6/19/2021 US All_US 6 309.4 2 26 6/26/2021 US All_US 6 308.3 2 27 7/3/2021 US All_US 7 306.3 3 28 7/10/2021 US All_US 7 305.6 3 29 7/17/2021 US All_US 7 308.2 3 30 7/24/2021 US All_US 7 307.2 3 31 7/31/2021 US All_US 8 305.6 3 32 8/7/2021 US All_US 8 306.3 3 33 1/10/2021 NE 34 1/17/2021 NE 35 1/24/2021 NE 36 1/31/2021 NE 37 2/7/2021 NE Region 1 293.2 1 Region 1 294.0 1 Region 1 294.0 1 Region 1 294.7 1 Region 2 301.1 1 Data Georgraphy code Quarter code Month code Region State City Bubble Chart + 55F Q Search H 10:14 PM 4/9/2023 Clear
Step by Step Solution
3.34 Rating (163 Votes )
There are 3 Steps involved in it
Sure here are the steps to complete the tasks 1 Open the workbook named Raiderxlsx and save the file as Raider Analysis Last Namexlsx 2 Create a series of charts Create a new worksheet named Region an... View full answer

Get step-by-step solutions from verified subject matter experts