

Question: Jane has a regression problem with two predictors x1 and 2: After Jane fits her data using linear regression, she computes the difference between actual
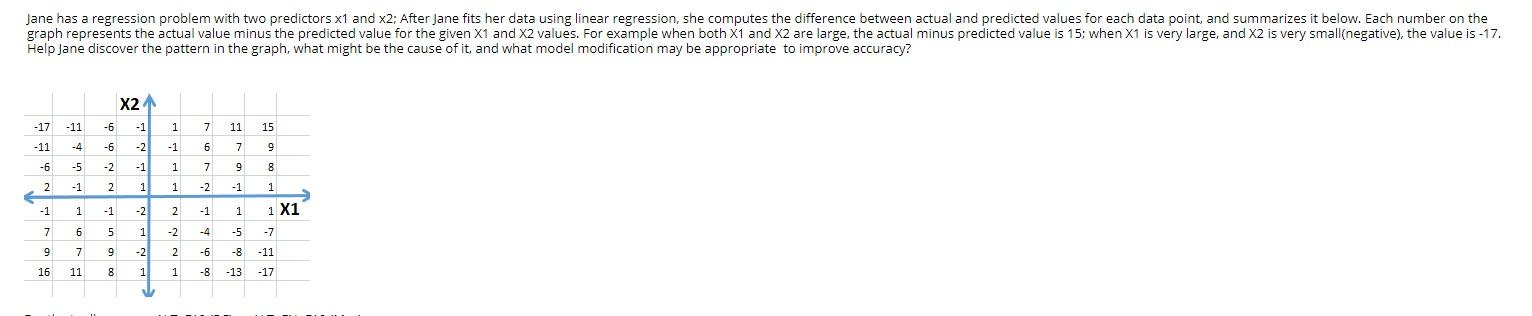
Jane has a regression problem with two predictors x1 and 2: After Jane fits her data using linear regression, she computes the difference between actual and predicted values for each data point, and summarizes it below. Each number on the graph represents the actual value minus the predicted value for the given X1 and X2 values. For example when both X1 and X2 are large, the actual minus predicted value is 15; when X1 is very large, and X2 is very small(negative), the value is -17. Help Jane discover the pattern in the graph, what might be the cause of it, and what model modification may be appropriate to improve accuracy? X2 -17 -11 -6 - 1 1 7 11 15 -11 -4 -6 -2 - 1 6 7 9 -6 -5 -2 - 1 1 7 9 8 2 -1 2 1 1 -2 - 1 1 - 1 1 -1 -2 2 -1 1 1 X1 7 6 5 1 -2 -4 -5 -7 9 7 9 -2 -6 -8 -11 2 1 16 11 8 1 -8 -13 -17
Step by Step Solution
There are 3 Steps involved in it

Get step-by-step solutions from verified subject matter experts