

Question: JAVA 1. Create a .java that automatically and randomly generates a record of grades for a parallel X, with notes for components: ACD (Teacher Contact
JAVA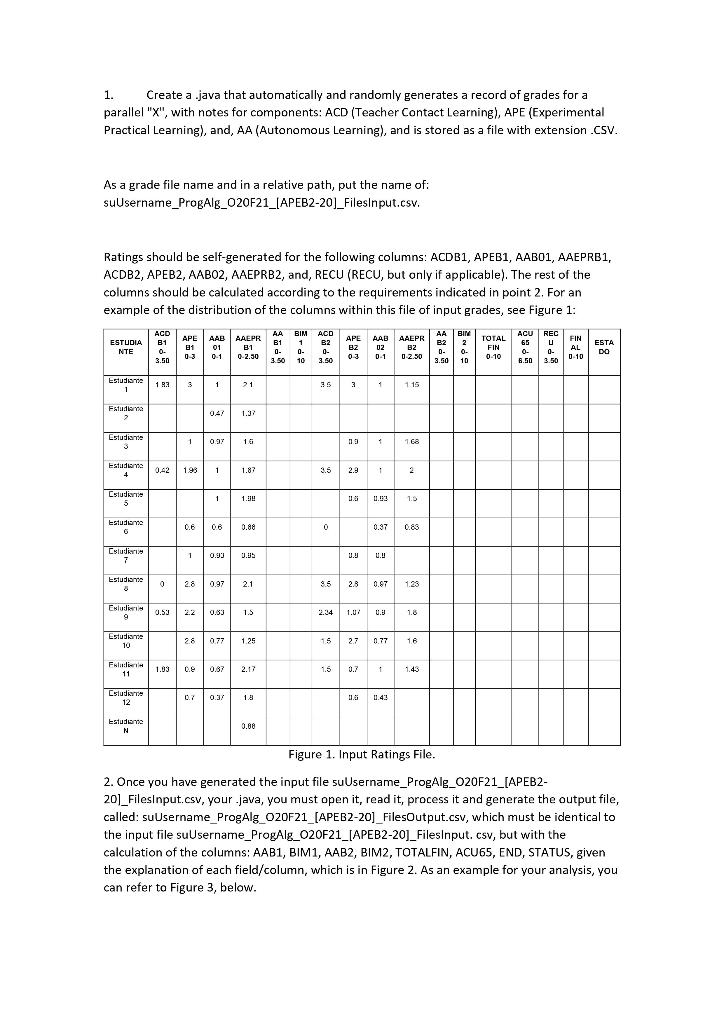
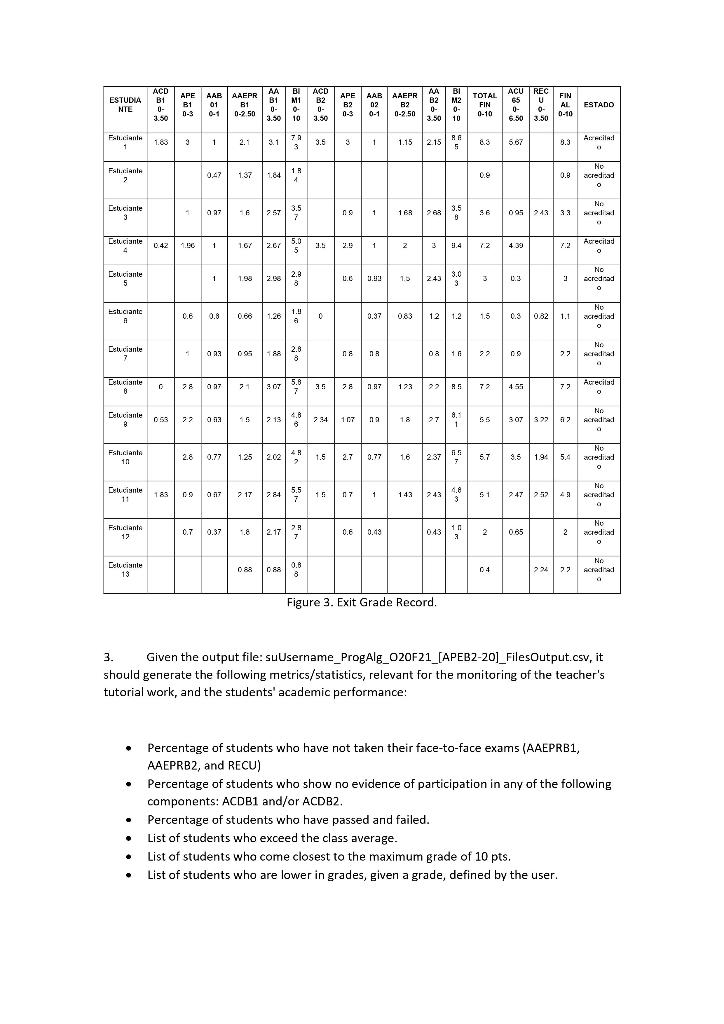
1. Create a .java that automatically and randomly generates a record of grades for a parallel "X", with notes for components: ACD (Teacher Contact Learning), APE (Experimental Practical Learning), and, AA (Autonomous Learning), and is stored as a file with extension CSV. As a grade file name and in a relative path, put the name of: suUsername_ProgAlg_020F21_[APEB2-20]_Filesinput.csv. Ratings should be self-generated for the following columns: ACDB1, APEB1, AAB01, AAEPRB1, ACDB2, APEB2, AABO2, AAEPRB2, and, RECU (RECU, but only if applicable). The rest of the columns should be calculated according to the requirements indicated in point 2. For an example of the distribution of the columns within this file of input grades, see Figure 1: ACU REC FIN ESTUDIA NTE ACD B1 0. 3.50 APE 81 0-3 AAB 01 0-1 AAEPR B1 0-2.30 AA B1 0- 3.50 BIM 1 0- 10 ACD B2 0- 3.50 APE BZ 0.3 02 0-1 AAEPR B2 BIN B2 2 D- 0. 3.50 10 FIN 0-10 65 0. 6.50 u 0 3.50 AL 0-10 ESTA DO 0 2.50 Estudisme | 18 3 1 21 3. 1 115 Estudiava 047 Estudiante 1 09 16 113 1 168 estudiants 0.42 1.93 1 1.87 3.5 + 2.9 1 2 Cstudiar 5 1 1.99 . 1.5 Estudisme 06 0 0.97 0.83 Csludir 7 10.99 0.US U.! Estudiante 2.1 9.5 23 0.87 1.23 Clad 0.53 0.53 9 1.5 1.8 Estudiante 26 077 1.25 15 2.7 n.77 16 10 F 1.83 0.8 0.87 2.17 1.5 1 1.43 11 Cstudiar 12 0.7 0.3 1.8 1.6 11.4! Estudiare N 3.88 Figure 1. Input Ratings File. 2. Once you have generated the input file suUsername_ProgAlg_020F21_[APEB2- 201_FilesInput.csv, your.java, you must open it, read it, process it and generate the output file, called: suUsername_ProgAlg_OZOF21_(APEB2-20]_FilesOutput.csv, which must be identical to the input file suUsername_ProgAlg_020F21_[APEB2-20]_FilesInput. csv, but with the calculation of the columns: AAB1, BIM1, AAB2, BIM2, TOTALFIN, ACU65, END, STATUS, given the explanation of each field/column, which is in Figure 2. As an example for your analysis, you can refer to Figure 3, below. ACD B1 ESTUDIA NIL APE B1 0-3 AABAAEPRAA B! ACD 01 B1 M1 B2 B1 0-1 0- 0- 0- 0-250 3.50 10 3.50 APE B2 24 0-3 AAB AAFPRMBI TOTAL 02 B2 B2 M2 FIN 0-1 0-2.50 0-0- 3.50 10 0-10 ACU REC 65 U 0- 0- 3.50 FIN AL ESTADO 3.50 Fxl.cinta 1.83 Anh: 1 72 3.1 3.5 3 3 2.1 1 1.15 2.15 8.3 567 3.3 5 1 0.47 1.37 1.84 1 R 4 09 0.8 No acred o 2 NO Deliciante 27 257 3.5 7 ns 1 1BRAR 3.5 B 095 33 3 Exluciante 1 1.6/ 2015: 5 2.3 1 2 4.39 Acrecitad o 4 Celuciante 5 1 1.95 296 2.8 8. U.C 3.0!! 1.D 243 3.0 3 0.3 1 NO acredra O 3 Esb.ciante No 1.9 0.6 0.8 0.68 1.26 0 0.97 083 12 1.2 1.5 0.3 0.82 1.1 o No Exluciante a 23 098 1882. ns DR 0316 22 27 8 Exluciante 78 5.8 1 35 78 2.97 1232 RS 72 455 72 Aureciland o Exluciente 8 053 22 093 213 4.8 8 7.34 10.7 na 18 271 55 307 37792 No sarahat 0 Fsh.ciante 16 0.77 4R 125 2023 1.5 2.7 | 0.77 1.6 2378 5.7 9.5 1.9 5.4 No acrediad o Exlucioni 11 183 09 097 7 17 784 5.5 7 n7 1 143 433 51 247 252 No scradha o Fsh.clanta 12 0.37 2.177 28 04310 3 2 0.85 2 Nu sedad o Exluciante 13 088 088 04 No sorodhad 22 27 8 Figure 3. Exit Grade Record. 3. Given the output file: suUsername_ProgAlg_020F21_[APEB2-20]_FilesOutput.csv, it should generate the following metrics/statistics, relevant for the monitoring of the teacher's tutorial work, and the students' academic performance: . . Percentage of students who have not taken their face-to-face exams (AAEPRB1, AAEPRB2, and RECU) Percentage of students who show no evidence of participation in any of the following components: ACDB1 and/or ACDB2. Percentage of students who have passed and failed. List of students who exceed the class average. List of students who come closest to the maximum grade of 10 pts. List of udents who are lower in grades, given a grade, defined by the user
Step by Step Solution
There are 3 Steps involved in it

Get step-by-step solutions from verified subject matter experts