

Question: PRICE The following graph shows equilibrium in a free market, with equilibrium quantity of QE. QUANTITY Supply Demand (?) For any level of output
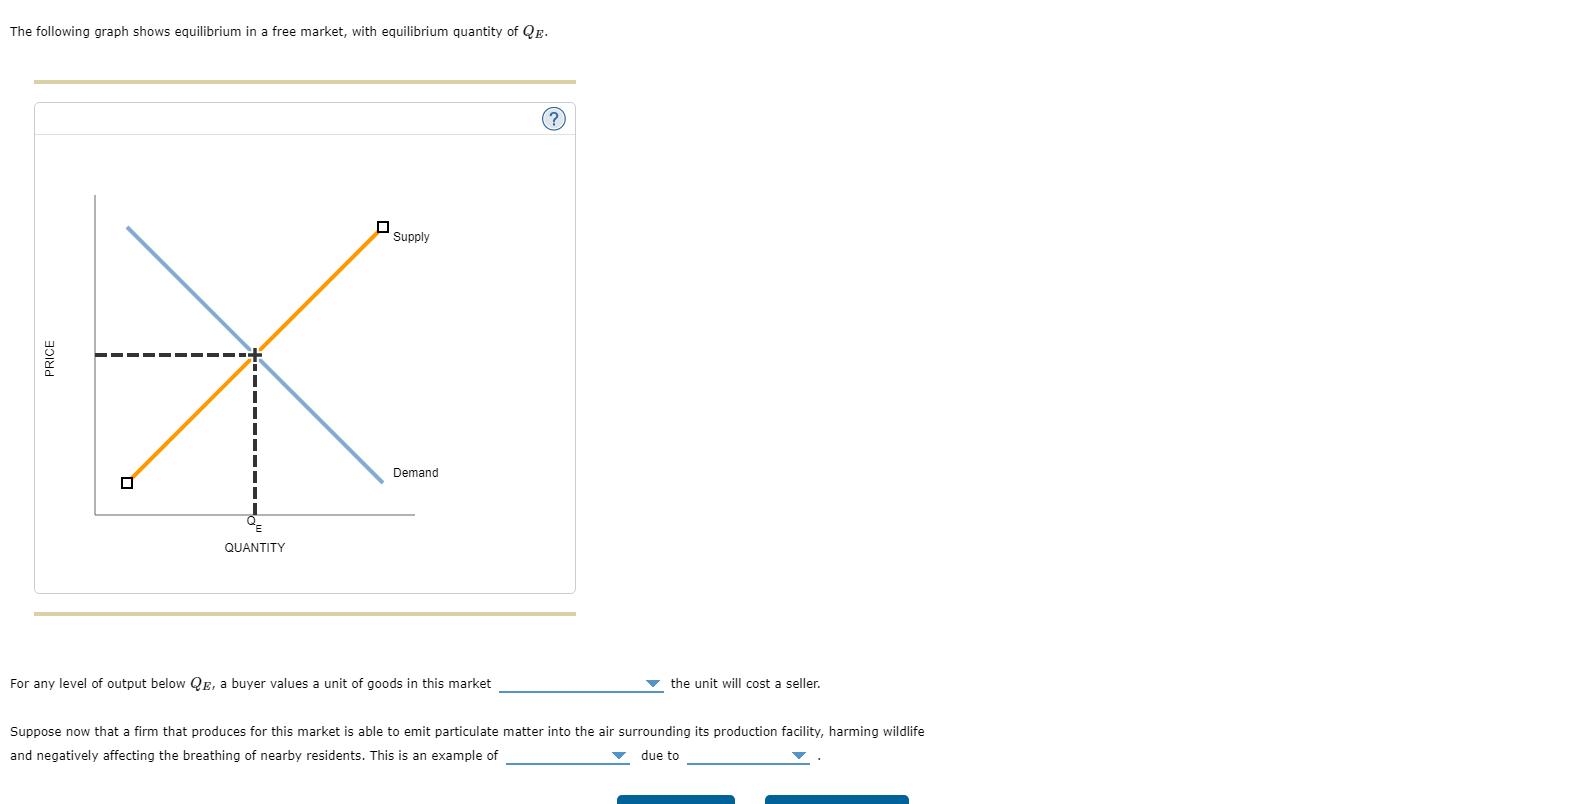
PRICE The following graph shows equilibrium in a free market, with equilibrium quantity of QE. QUANTITY Supply Demand (?) For any level of output below QE, a buyer values a unit of goods in this market the unit will cost a seller. Suppose now that a firm that produces for this market is able to emit particulate matter into the air surrounding its production facility, harming wildlife and negatively affecting the breathing of nearby residents. This is an example of due to
Step by Step Solution
There are 3 Steps involved in it
Q E represents the equilibrium quantity In equilibrium the value placed on a unit of the good by the ... View full answer

Get step-by-step solutions from verified subject matter experts