

Question: Java Joe Inc. operates a chain of lunch stops. The company is considering two possible expansion plans. Plan A would open eight smaller shops at
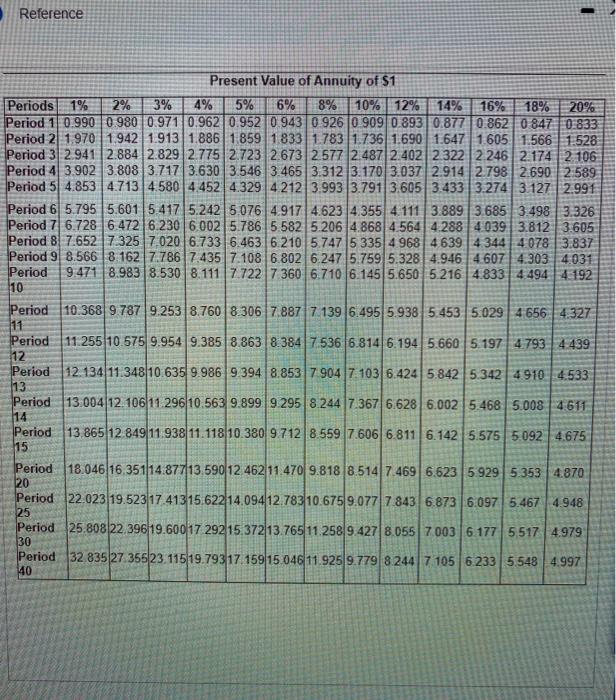
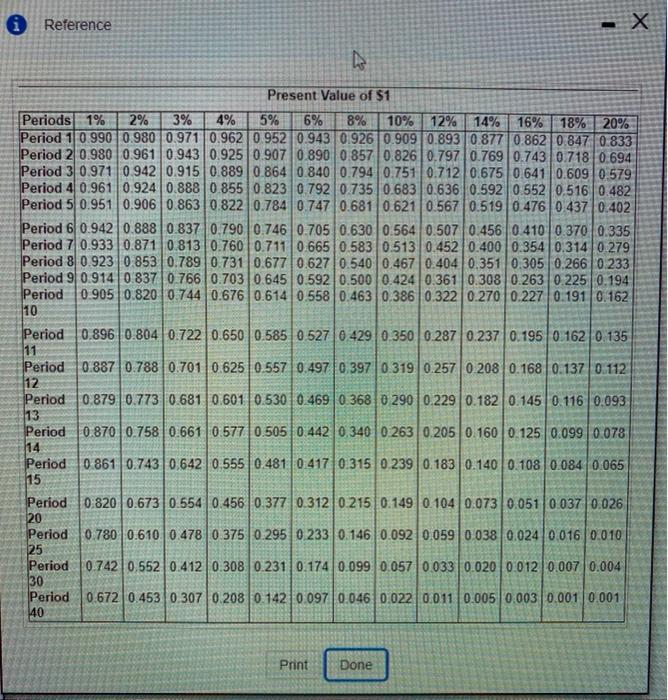
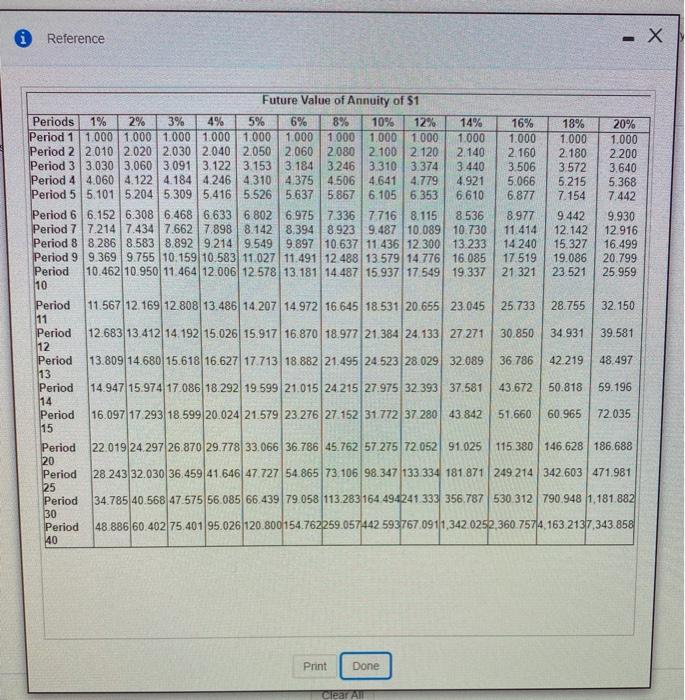
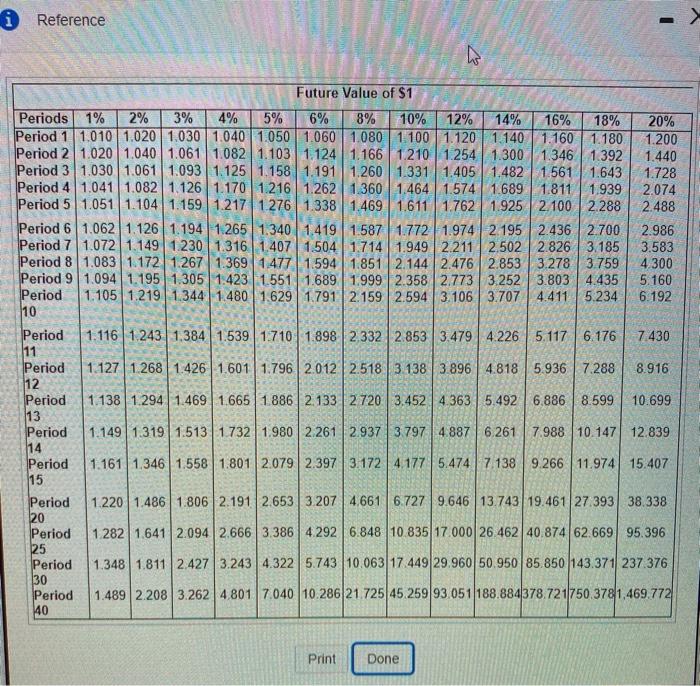
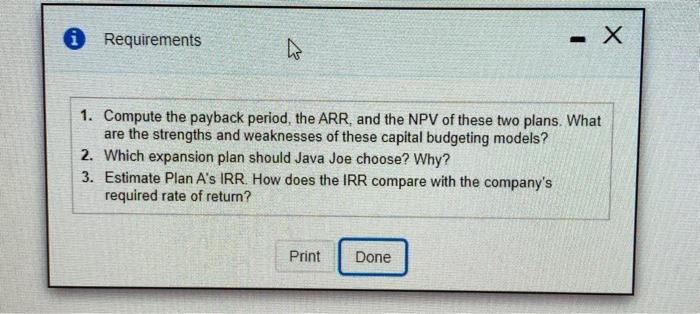

Reference 3% 8% Present Value of Annuity of $1 Periods 1% 2% 4% 5% 6% 10% 12% 14% 16% 18% 20% Period 10.990 0.980 0.971 0.962 0.952 0.943 0 926 10 909 0.8930.877 0.8620 847 0.833 Period 2 1.970 1.942 1913 1.886 1859 1833 1.783 1.736 1.690 1.647 1.6051.566 1.528 Period 3 2.9412.8842.8292.775 2.723 2.673 2577 2.487 2.4022322 12 246 2.1742 106 Period 4 3.902 3.8083.7173.630 3.546 3.4653.312 3.170 3.037 2.9142.798 2.690.2 589 Period 5 4.853 4.7134.580 4.452 4.329 4 2123.993 3.791 3.6053.433 3.274 3.127 2.991 Period 6 5.795 5.601 5.417 5.2425.076 4.917 4.623 4.355 4 111 3.8893.685 3.498 3.326 Period 7 6.728 6 472|6.2306 002 5.786 5 582 5.206 4.868 4.564 4.288 4 039 3.812 3.605 Period 8 7.652 7.325 7020 6.733 6.4636.210 5.747 5 335 4.968 4 639 4 344 4078 3.837 Period 9 8.566 8 1627.786 7.4357.108 6.802 6 247 5.759 5.328 4.946 | 4.607 4.303 4.031 Period 9.471 8.9838.530 8.1117.722 7 360 6.710 6.145 5.650 5 216 4.833 4 494 4. 192 10 Period 10.368 9.7879.2538.760 8.3067.887 7.139 6.495 5.9385.453 5.029 4 656 4327 11 Period 11.255 10.575 9.954 9.3858.8638.384 7.536 6.8146.1945.660 5 1974.793 4.439 12 Period 12.134 11.348 10.635 9.9869.3948.853 7 904 7 103 6.424 5.842 5.342 4910 4.533 13 Period 13.004 12 106 11 296 10.563 9.899 9.2958.244 7.367 6.628 6.0025 468 5.0084611 14 Period 13 865 12 849 11.938 11.118 10.380 9.712 8.559 7.606 6.811 6.142 5.575 5092 | 4.675 15 Period 18.046 16.35114.877|13.590 12 462 11.470 9.818 8.514 7.4696.623 5.929 5.3534.870 20 Period 22.023 19.52317 41315.622 14.094 12.78310.675 9.077 78436.8736.097 5.467 4.948 25 Period 25.80822.39619.60017 292 15.372 13.765 11.258 9.427 8.0557003|6 177 5517 4.979 30 Period 32 835 27.35523. 11519.793 17.15915 04611.925 9.779 8 244 7 1056 233 5.548 4.997 140 i Reference -X A Present Value of $1 Periods 1% 2% 3% 4% 5% 6% 8% 10% 12% 14% 16% 18% 20% Period 10.990 0.980 0.9710.9620.952 0.943 019260.9090.8930 877 0.862 0.847 0.833 Period 20.980 0.961 0.943 0.925 0.907 0.890 0.857 0.8260.797 10.769 0.743 0.7180.694 Period 30.971 0.942 0.915 0.8890.864 0.840 0.794 0.751 0.712 0.675 0.6410.609 0.579 Period 4 0.961 0.9240.888 0.855 0.823 0.792 0.735 0.683 0.636 0.592 0.552 0.516 0.482 Period 5 0.951 0.906 0.8630.822 0.784 0.747 0.681 0.621 0.5670.519 0.476 0.437 0.402 Period 60.9420.888 0.837 0.790 0.746 0.705 0.630 0.564 0.5070.456 0.410 0.370 0.335 Period 7 0.933 0.871 0.8130.760 0.7110.665 0.583 0.513 0.4520.400 0.3540.314 0 279 Period 8 0.923 0.853 0.789 0.731 0.677 0.627 0.540 0.467 0.4040.3510.305 0.266 0.233 Period 9 0.9140.8370.766 0.7030.6450.592 0.500 0.424 0.361 0.308 0.263 0.225 0.194 Period 0.905 0.820 0.744 0.676 0.614 0.558 0.4630.386 0.322 0.270 0.227 0.191 0.162 10 Period 0.896 0.8040.722 0.650 0.585 0.5270429 0.350 0.287 0.2370.195 0.162 0.135 11 Period 10.8870.788 0.701 0.625 0.557 0.497 | 0.397 0.319 0.257 0.208 0.168 0.137 0.112 12 Period 0.879 0.773 0.681 0.601 0.530 0.469 0 3680 290 0.229 0.182 0.145 0.116 0.093 13 Period 0.870 0.7580-6610.577 0.505 10 442 0.3400 263 0.205 0.160 0.125 0.0990.078 14 Period 0 861 0.7430,642 0.555 0.481 0 4170 315 0.239 0.183 0.140 0.108 0.084 0.065 15 Period 10.820 0.673 0.554 0.456 0.377 0.312 0.215 0.149 0.104 0.073 0.051 0.037 0.026 20 Period 0.780 0.610 0.478 0.375 0.295 0.233 0.146 0.092 0.059 0.038 0.024 0.0160.010 25 Period 0.742 0.552 0.412 0.308 0.231 0.174 0,099 0.0570033 0.0200.012 0.007 0.004 30 Period 0.672 0.453 0.307 0.208 0.142 0.097 0.046 0 022 0.011 0.005 0.003 0.001 0.001 140 Print Done * Reference - 16% 1.000 2.160 3.506 5.066 6.877 Future Value of Annuity of $1 Periods 1% 2% 3% 4% 5% 6% 8% 10% 12% 14% Period 11.000 1.000 1.000 1.000 1.000 1.000 1000 1.000 1.000 1.000 Period 2 2.010 2020 2030 2040 2050 2060 2.080 2.100 2.120 2 140 Period 3 3.030 3,060 3.091 3.122 3.153 3.1843246 3.310 3.374 3.440 Period 44.060 4.122 4.184 4.246 4.310 4 375 4.506 4641 4.779 4.921 Period 5 5.101 5204 5.309 5.416 5.526 5.637 5.867 | 6.105 6 353 6.610 Period 66.152 6.308 6.468 6.633 6 802 6.9757 336 7716 8. 115 8.536 Period 77.214 7.434 7.6627.898 8.142 8,394 8.923 9.487 10.089 10.730 Period 8 8 286 8.583 | 8.8929.214 9.549 9.897 10.637 11 436 12.300 13.233 Period 9 9.369 9.755 10.159 10.583 11.027 11.491 | 12 488 13.579 14.776 16.085 Period 10.462 10.950 11.464 12.006 12 578 13.181 14 487 15.937 17.549 19,337 10 Period 11.567 12. 169 12.808 13.486 14.207 14.972 16.645 18.531 20.655 23.045 11 Period 12.683 13.412 14.192 15.026 15.917 16.870 18.977 21.384 24 133 27 271 12 Period 13.809 14.680 15.618 16.62717 713 18.882 21.495 24 523 28.029 32.089 18% 1.000 2.180 3.572 5,215 7.154 9.442 12.142 15.327 19.086 23.521 20% 1.000 2.200 3.640 5.368 7.442 8.977 11.414 14.240 17.519 21 321 9.930 12.916 16.499 20.799 25.959 25.733 28.755 32.150 30.850 34.931 39.581 36 786 42.219 48,497 13 14.947 15.974 17.086 18.292 19.599 21.01524.215 27.975 32.393 37.581 43 672 50.818 59.196 16.097 17 29318.599 20.024 21.579 23 276 27 152 31.772 37 280 43.842 51.660 60.965 72.035 22.019 24.297 26,870 29.778 33.066 36.786 45.762 57 275 72.052 91.025 115 380 146.628 186.688 Period 14 Period 15 Period 120 Period 25 Period 30 Period 140 28.243 32.030 36.459 41.646 47.727 54.865 73.106 98.347 133 334 181.871 249 214 342.603 471.981 34.785 40.568 47.575 56.085 66 43979.058 113.283 164 494.241.333 356.787530.312790.948 1,181.882 48.88660.402 75.401 95.026120.800 154.762259.057442 593767 0911 342 0252,360 757 4.163.2137.343.858 Print Done CleaTA i Reference Future Value of $1 Periods 1% 2% 3% 4% 5% 6% 8% 10% 12% 14% 16% 18% 20% Period 1 1.010 1.020 1030 1.040 1.050 1.0601.080 1.100 1.120 1.140 1.160 1.180 1.200 Period 21.020 1.040 1.061 1.0821.103 1.1241.166 1210 1.254 1.300 1.346 1.392 1.440 Period 31.030 1.0611.0931.125 1.158 1.191 1.260 1.331 1.405 1.482 1.561 1.643 1.728 Period 41.041 1.0821.126 1.170 1.216 1.262 1.360 1.464 1.574 1.689 1.811 1.939 2.074 Period 5 1.0511.104 1.159 1.217 1276 1.338 1.469 1.611 1.762 1.925 2.100 2.288 2.488 Period 6 1.062 1.126 1.194 1.265 1.340 1.419 15871772 1.9742.195 2.436 2.700 2.986 Period 7 1.072 1.149 1230 1.316 1.407 1.504 1.714 1.949 2.211 2.502 2.826 3.185 3.583 Period 8 1.083 1.172 1.267 1.369 1477 1.594 1.851 2.144 2.476 2.853 3.278 3.759 4.300 Period 91.094 1.1951.305 1.423 1.551 1.6891.999 2.3582.7733.252 3.803 4.435 5.160 Period 1.105 1.219 1.344 1.480 1.629 1791 2.159 2.594 3.106 3.707 4.411 5.234 6.192 10 Period 1.116 1.243 1.3841.539 1.710 1.898 2.3322853 3.479 4.226 5.117 6.176 7.430 11 Period 1:127 12681.426 1.601 1.796 2.0122.518 3 138 3.896 4.818 5.9367.288 8.916 12 Period 1.1381.294 1.469 1.6651.886 2.133 2720 3.4524.363 5.492 | 6.886 8.599 10.699 13 Period 1.1491.3191.513 1.732 1.980 2.261 2.937 3.7974.887 6.261 7.988 10.147 12.839 14 Period 1.161 1.346 1.558 1.8012.0792.397 3.172 4.1775.474 7 138 9.266 11.974 15.407 15 Period 1.220 1.486 1.806 2.1912.653 3 2074661 6.727 9.646 13.743 19.461 27.393 38.338 20 Period 1 282 1641 2.094 2.666 3.386 4.292 6.848 10 835 17.000 26.462 40.874 62.669 95.396 25 Period 1.348 1.811 2.427 3.243 4.322 5.743 10.06317.449 29.960 50.950 85.850 143.371 237 376 30 Period 1.489 2.208 3.2624 801 7.040 10.286 21725 45 259 93051188.884378.721750.3781,469.772 140 Print Done * Requirements - X 1. Compute the payback period, the ARR, and the NPV of these two plans. What are the strengths and weaknesses of these capital budgeting models? 2. Which expansion plan should Java Joe choose? Why? 3. Estimate Plan A's IRR. How does the IRR compare with the company's required rate of return? Print Done Requirement 1. Compute the payback period, the ARR, and the NPV of these two plans. What are the strengths and weaknesses of these capital budgeting models? Begin by computing the payback period for both plans. (Round your answers to one decimal place) Plan A (in years) Plan B (in years)
Step by Step Solution
There are 3 Steps involved in it

Get step-by-step solutions from verified subject matter experts