

Question: java program Note: You can use excel or another plotting package to plot your graphs. Part A: 120 marks 1) Implement the GCD (Greater CommonDivisor)
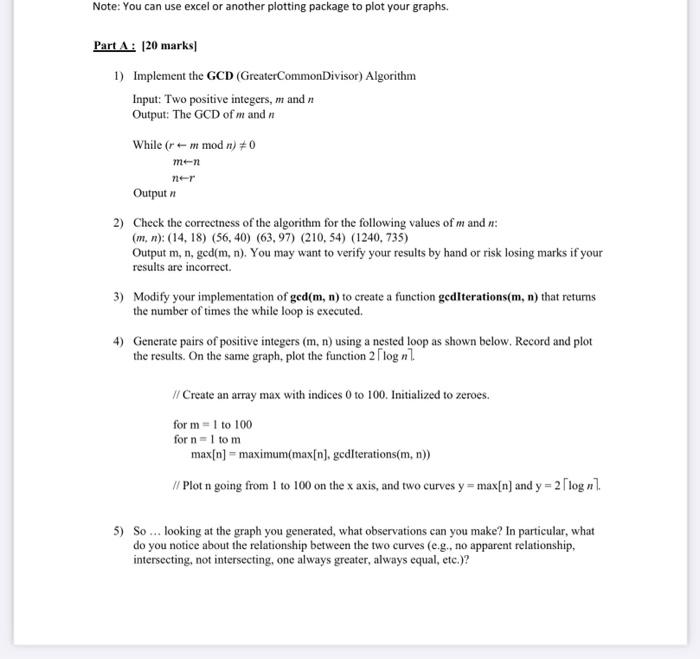
Note: You can use excel or another plotting package to plot your graphs. Part A: 120 marks 1) Implement the GCD (Greater CommonDivisor) Algorithm Input: Two positive integers, m and n Output: The GCD of m and n While (r+-mmod n) #0 men Output 2) Check the correctness of the algorithm for the following values of mand : (m.n): (14, 18) (56, 40) (63,97) (210, 54) (1240.735) Output m, n, ged(m, n). You may want to verify your results by hand or risk losing marks if your results are incorrect 3) Modify your implementation of ged(m, n) to create a function gedlterations(m, n) that returns the number of times the while loop is executed. 4) Generate pairs of positive integers (m,n) using a nested loop as shown below, Record and plot the results. On the same graph, plot the function 2 Plog nl // Create an array max with indices 0 to 100. Initialized to zeroes. form 1 to 100 for n=1 to m max[n] = maximum(max[n), gedlterations(m, n)) // Plot n going from 1 to 100 on the x axis, and two curves y=max[n] and y= 2 log nl. 5) So... looking at the graph you generated, what observations can you make? In particular, what do you notice about the relationship between the two curves (e.g., no apparent relationship, intersecting, not intersecting, one always greater, always equal, etc.)
Step by Step Solution
There are 3 Steps involved in it

Get step-by-step solutions from verified subject matter experts