

Question: Jerry's Consumption Function E uopdunsuou skuar non 1 1 45 D Y Y2 Jerry's Income Figure 8.2 Refer to Figure 8.2. Jerry's consumption equals his
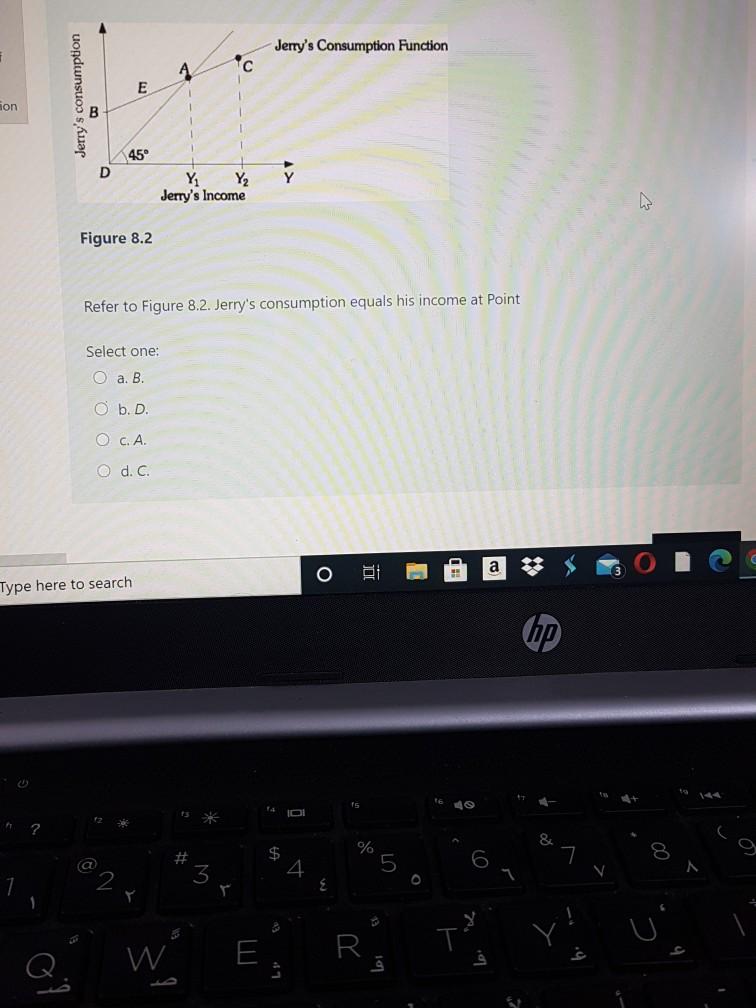
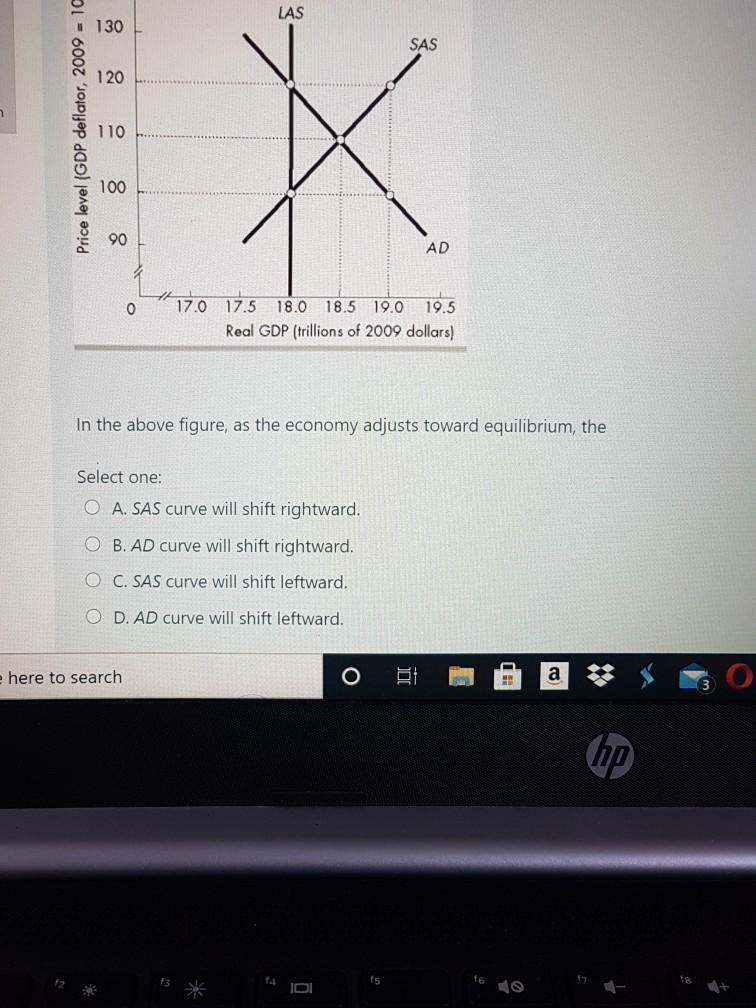
Jerry's Consumption Function E uopdunsuou skuar non 1 1 45 D Y Y2 Jerry's Income Figure 8.2 Refer to Figure 8.2. Jerry's consumption equals his income at Point Select one: O a B O b.D. c. A O d. C. o BD Type here to search hp 15 % $ # 3 5 W E. R LAS 130 SAS 120 Price level (GDP deflator, 2009 - 10 110 X 100 90 AD ZA O 17.0 17.5 18.0 18.5 19.0 19.5 Real GDP (trillions of 2009 dollars) In the above figure, as the economy adjusts toward equilibrium, the Select one: O A. SAS curve will shift rightward. O B. AD curve will shift rightward. O C. SAS curve will shift leftward. O D. AD curve will shift leftward. e here to search 8 a hp
Step by Step Solution
There are 3 Steps involved in it
1 Expert Approved Answer
Step: 1 Unlock

Question Has Been Solved by an Expert!
Get step-by-step solutions from verified subject matter experts
Step: 2 Unlock
Step: 3 Unlock