

Question: JK Design 0% GETTING STARTED Open the file JK Design.xlsx JK Design has just prepared their Income Statement for the 2020 and they would like
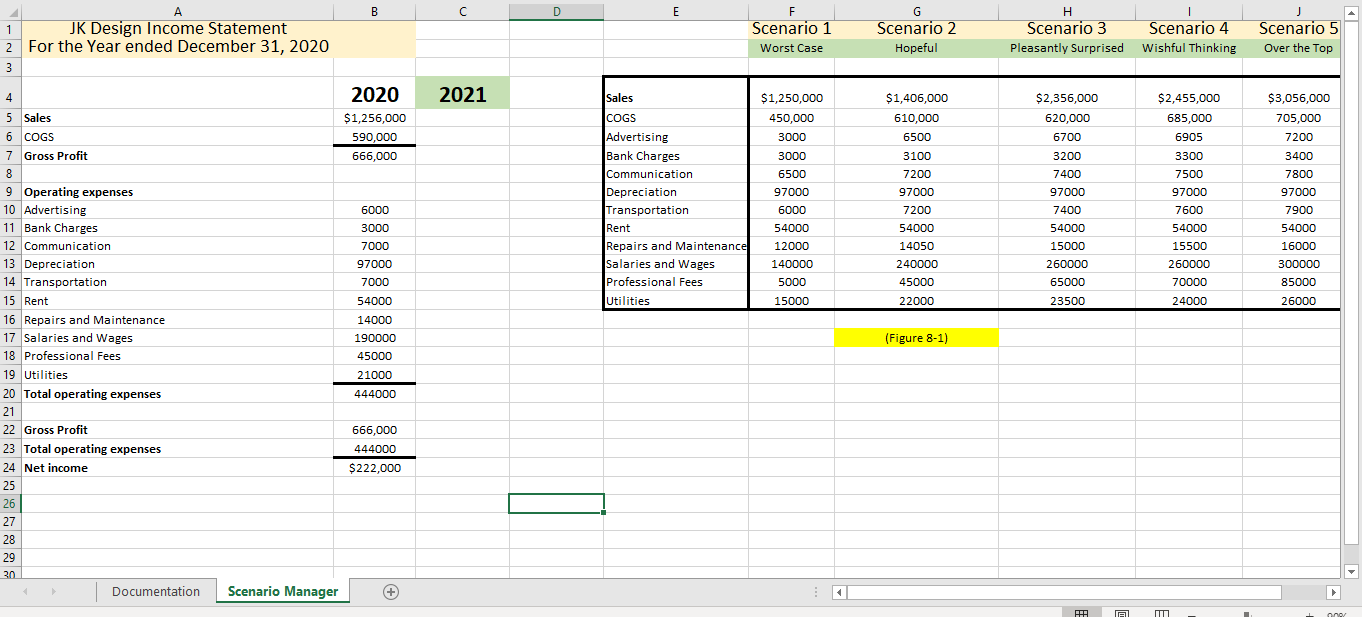
JK Design 0% GETTING STARTED Open the file JK Design.xlsx JK Design has just prepared their Income Statement for the 2020 and they would like to forecast their 2021 results. Due to the Pandemic they have several scenarios they would like to investigate (Worst Case, Hopeful, Pleasantly Surprised, Wishful Thinking and Over the Top). They would like you to prepare an analysis that would show them the effects on Gross Profit, Total Operating Expenses and Net Income under each situation and present it to them in the form of a Summary Report as well as a Pivot Chart (use best practices when preparing Pivot Charts). Requirements 1) Prepare a Summary report detailing the various scenarios (15 marks) 2) Include a Pivot Chart to support your decision (5 marks) B D E 1 JK Design Income Statement 2 For the Year ended December 31, 2020 F Scenario 1 Worst Case Scenario 2 Hopeful Scenario 3 Scenario 4 Pleasantly surprised Wishful Thinking Scenario 5 Over the Top 3 4 2021 $1,250,000 450.000 $3,056,000 705,000 2020 $1,256,000 590,000 666,000 3000 3000 6500 $2,455,000 685,000 6905 3300 7500 7200 3400 Sales COGS Advertising Bank Charges Communication Depreciation Transportation Rent Repairs and Maintenancel Salaries and Wages Professional Fees Utilities $1,406,000 610,000 6500 3100 7200 97000 7200 54000 14050 240000 45000 97000 $2,356,000 620,000 6700 3200 7400 97000 7400 54000 15000 260000 65000 97000 6000 54000 12000 140000 5000 15000 6000 7600 54000 15500 260000 7800 97000 7900 54000 16000 300000 85000 70000 22000 23500 24000 26000 5 Sales 6 COGS 7 Gross Profit 8 9 Operating expenses 10 Advertising 11 Bank Charges 12 Communication 13 Depreciation 14 Transportation 15 Rent 16 Repairs and Maintenance 17 Salaries and Wages 18 Professional Fees 19 Utilities 20 Total operating expenses 21 22 Gross Profit 23 Total operating expenses 24 Net income 25 26 27 28 29 30 Documentation 3000 7000 97000 7000 54000 14000 190000 45000 21000 444000 (Figure 8-1) 666,000 444000 $222.000 Scenario Manager + HH B ng JK Design 0% GETTING STARTED Open the file JK Design.xlsx JK Design has just prepared their Income Statement for the 2020 and they would like to forecast their 2021 results. Due to the Pandemic they have several scenarios they would like to investigate (Worst Case, Hopeful, Pleasantly Surprised, Wishful Thinking and Over the Top). They would like you to prepare an analysis that would show them the effects on Gross Profit, Total Operating Expenses and Net Income under each situation and present it to them in the form of a Summary Report as well as a Pivot Chart (use best practices when preparing Pivot Charts). Requirements 1) Prepare a Summary report detailing the various scenarios (15 marks) 2) Include a Pivot Chart to support your decision (5 marks) B D E 1 JK Design Income Statement 2 For the Year ended December 31, 2020 F Scenario 1 Worst Case Scenario 2 Hopeful Scenario 3 Scenario 4 Pleasantly surprised Wishful Thinking Scenario 5 Over the Top 3 4 2021 $1,250,000 450.000 $3,056,000 705,000 2020 $1,256,000 590,000 666,000 3000 3000 6500 $2,455,000 685,000 6905 3300 7500 7200 3400 Sales COGS Advertising Bank Charges Communication Depreciation Transportation Rent Repairs and Maintenancel Salaries and Wages Professional Fees Utilities $1,406,000 610,000 6500 3100 7200 97000 7200 54000 14050 240000 45000 97000 $2,356,000 620,000 6700 3200 7400 97000 7400 54000 15000 260000 65000 97000 6000 54000 12000 140000 5000 15000 6000 7600 54000 15500 260000 7800 97000 7900 54000 16000 300000 85000 70000 22000 23500 24000 26000 5 Sales 6 COGS 7 Gross Profit 8 9 Operating expenses 10 Advertising 11 Bank Charges 12 Communication 13 Depreciation 14 Transportation 15 Rent 16 Repairs and Maintenance 17 Salaries and Wages 18 Professional Fees 19 Utilities 20 Total operating expenses 21 22 Gross Profit 23 Total operating expenses 24 Net income 25 26 27 28 29 30 Documentation 3000 7000 97000 7000 54000 14000 190000 45000 21000 444000 (Figure 8-1) 666,000 444000 $222.000 Scenario Manager + HH B ng
Step by Step Solution
There are 3 Steps involved in it

Get step-by-step solutions from verified subject matter experts