

Question: , Jocelyn Company wants to predict conversion costs using regression. The following data was collected for 12 periods: conversion costs, machine hours, # of units
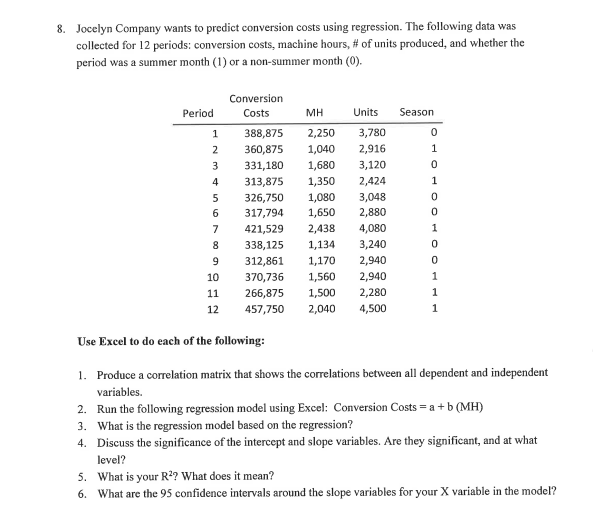
, Jocelyn Company wants to predict conversion costs using regression. The following data was collected for 12 periods: conversion costs, machine hours, # of units produced, and whether the period was a summer month (17 or a non-summer month {{0). Canversion Period Costs MH Units Season 1 383,875 2,250 3,780 0 2 160,875 1,040 2,915 1 3 331,180 1,680 3,120 0 4 313,875 1,350 2,424 i 5 326,750 1,080 3,048 0 6 317,794 1,650 2,880 0 7 421,529 2,438 4,080 1 8 338,125 1,134 3,240 0 9 312,861 1,170 2,540 0 10 370,736 1,560 2,940 1 i1 266,875 1,500 2,280 1 12 457,750 2,040 4,500 1 Use Excel to do each of the following: |. Produce a correlation matrix that shows the correlations between all dependent and independent variables. 2. Run the following regression model using Excel: Conversion Costs =a + b (MH) 3. What is the regression model based on the regression? 4. Discuss the significance of the intercept and slope variables. Are they significant, and at what level? 5. What is your R?? What does it mean? What are the 95 confidence intervals around the slope variables for your X variable in the model
Step by Step Solution
There are 3 Steps involved in it

Get step-by-step solutions from verified subject matter experts