

Question: John wanted to create a regression model relating the age variable to some other variables. To that end, John decided to look at the correlation
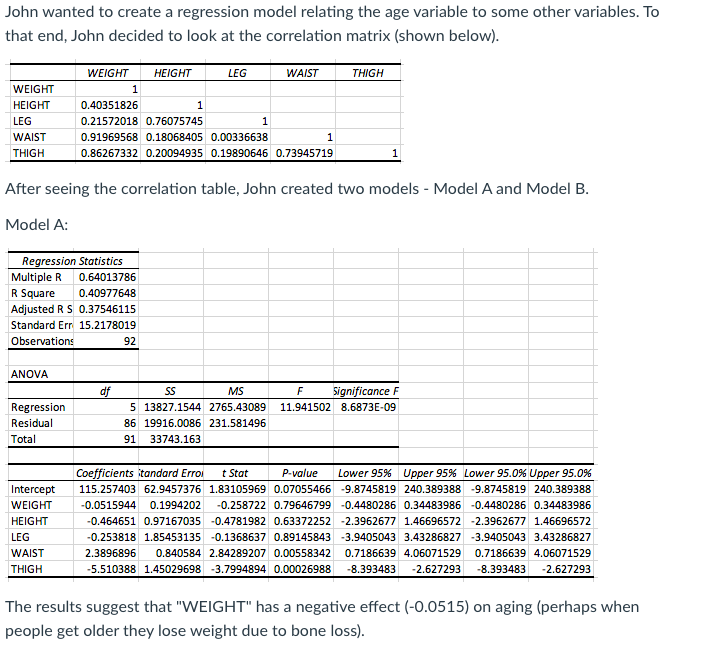
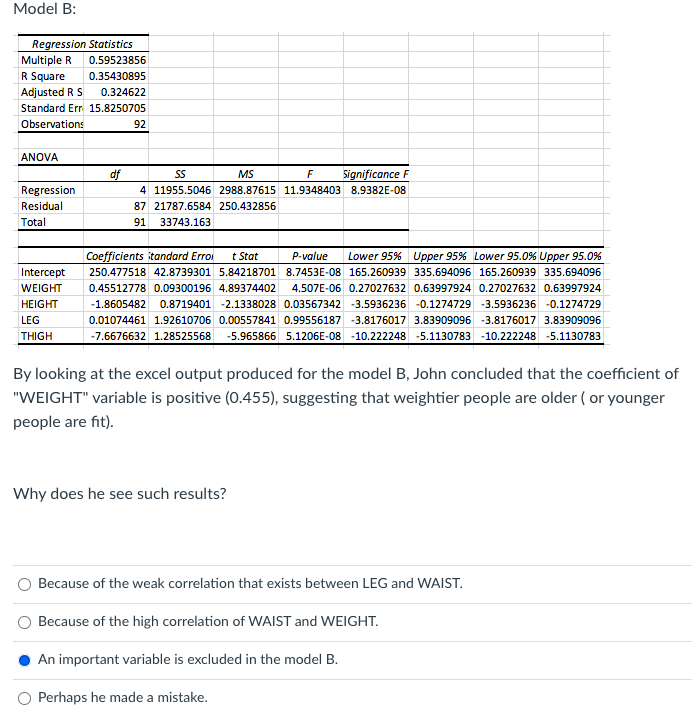
John wanted to create a regression model relating the age variable to some other variables. To that end, John decided to look at the correlation matrix (shown below). WEIGHT HEIGHT LEG WAIST THIGH WEIGHT HEIGHT 0.40351826 1 LEG 0.21572018 0.76075745 1 WAIST 0.91969568 0.18068405 0.00336638 THIGH 0.86267332 0.20094935 0.19890646 0.73945719 1 After seeing the correlation table, John created two models - Model A and Model B. Model A: Regression Statistics Multiple R 0.64013786 R Square 0.40977648 Adjusted R 5 0.37546115 Standard Err 15.2178019 Observations 92 ANOVA dif SS MS F Significance F Regression 5 13827.1544 2765.43089 11.941502 8.6873E-09 Residual 86 19916.0086 231.581496 Total 91 33743.163 Coefficients itandard Error t Stat P-value Lower 95% Upper 95%% Lower 95.0% Upper 95.0% Intercept 115.257403 62.9457376 1.83105969 0.07055466 -9.8745819 240.389388 -9.8745819 240.389388 WEIGHT 0.0515944 0.1994202 -0.258722 0.79646799 -0.4480286 0.34483986 -0.4480286 0.34483986 HEIGHT 0.464651 0.97167035 -0.4781982 0.63372252 -2.3962677 1.46696572 -2.3962677 1.46696572 LEG 0.253818 1.85453135 -0.1368637 0.89145843 -3.9405043 3.43286827 -3.9405043 3.43286827 WAIST 2.3896896 0.840584 2.84289207 0.00558342 0.7186639 4.06071529 0.7186639 4.06071529 THIGH -5.510388 1.45029698 -3.7994894 0.00026988 -8.393483 -2.627293 -8.393483 -2.627293 The results suggest that "WEIGHT" has a negative effect (-0.0515) on aging (perhaps when people get older they lose weight due to bone loss).Model B: Regression Statistics Multiple R 0.59523856 R Square 0.35430895 Adjusted R 5 0.324622 Standard Err 15.8250705 Observations 92 ANOVA df SS MS F Significance F Regression 4 11955.5046 2988.87615 11.9348403 8.9382E-08 Residual 87 21787.6584 250.432856 Total 91 33743.163 Coefficients itandard Error t Stat P-value Lower 95% Upper 95% Lower 95.0% Upper 95.0% Intercept 250.477518 42.8739301 5.84218701 8.74538-08 165.260939 335.694096 165.260939 335.694096 WEIGHT 0.45512778 0.09300196 4.89374402 4.507E-06 0.27027632 0.63997924 0.27027632 0.63997924 HEIGHT -1.8605482 0.8719401 -2.1338028 0.03567342 -3.5936236 -0.1274729 -3.5936236 -0.1274729 LEG 0.01074461 1.92610706 0.00557841 0.99556187 -3.8176017 3.83909096 -3.8176017 3.83909096 THIGH -7.6676632 1.28525568 -5.965866 5.1206E-08 -10.222248 -5.1130783 -10.222248 -5.1130783 By looking at the excel output produced for the model B, John concluded that the coefficient of "WEIGHT" variable is positive (0.455), suggesting that weightier people are older ( or younger people are fit). Why does he see such results? O Because of the weak correlation that exists between LEG and WAIST. O Because of the high correlation of WAIST and WEIGHT. An important variable is excluded in the model B. O Perhaps he made a mistake
Step by Step Solution
There are 3 Steps involved in it

Get step-by-step solutions from verified subject matter experts