

Question: JONES ELECTRICAL DISTRIBUTION REQUIRED: After studying the Jones case thoroughly, assume that you are the assistant to Rachel Montrose, the loan officer of Southern Bank
JONES ELECTRICAL DISTRIBUTION REQUIRED: After studying the Jones case thoroughly, assume that you are the assistant to Rachel Montrose, the loan officer of Southern Bank &Trust. In the Module 1 Workshop, you answered her questions about Jones' financial performance and position. Ms. Montrose now wants you to use the attached worksheets to answer the following Questions: 1. What was the major cause of the need for external financing during 2004-2006? 2. What are Jones' internal and sustainable growth rates based on 2006 data? 3. How much external financing does Jones really need for 2007? * 4. Should the bank grant Jones the $350,000 line of credit? Why or why not? *For the 2007 forecast, use the Jones case data, the following assumptions, and any additional assumptions you think are needed: It is December 31, 2006; that is, ignore the 2007 first quarter data. Sales will be $2.7 million. As Jones will take the 2% discount on all purchases, Gross Margin will equal 20%. Purchases = Cost-of-Goods-Sold There will be no change in interest expense. The tax rate is 35%. Cash, accounts receivable, and inventory will increase in proportion to sales. No change in property, plant, and equipment. Accrued Expenses will increase in proportion to sales. The $249,000 loan at the end of 2006 will be paid off from the new credit line. Long-term debt will be paid down $24,000. All earnings will be retained in the business.
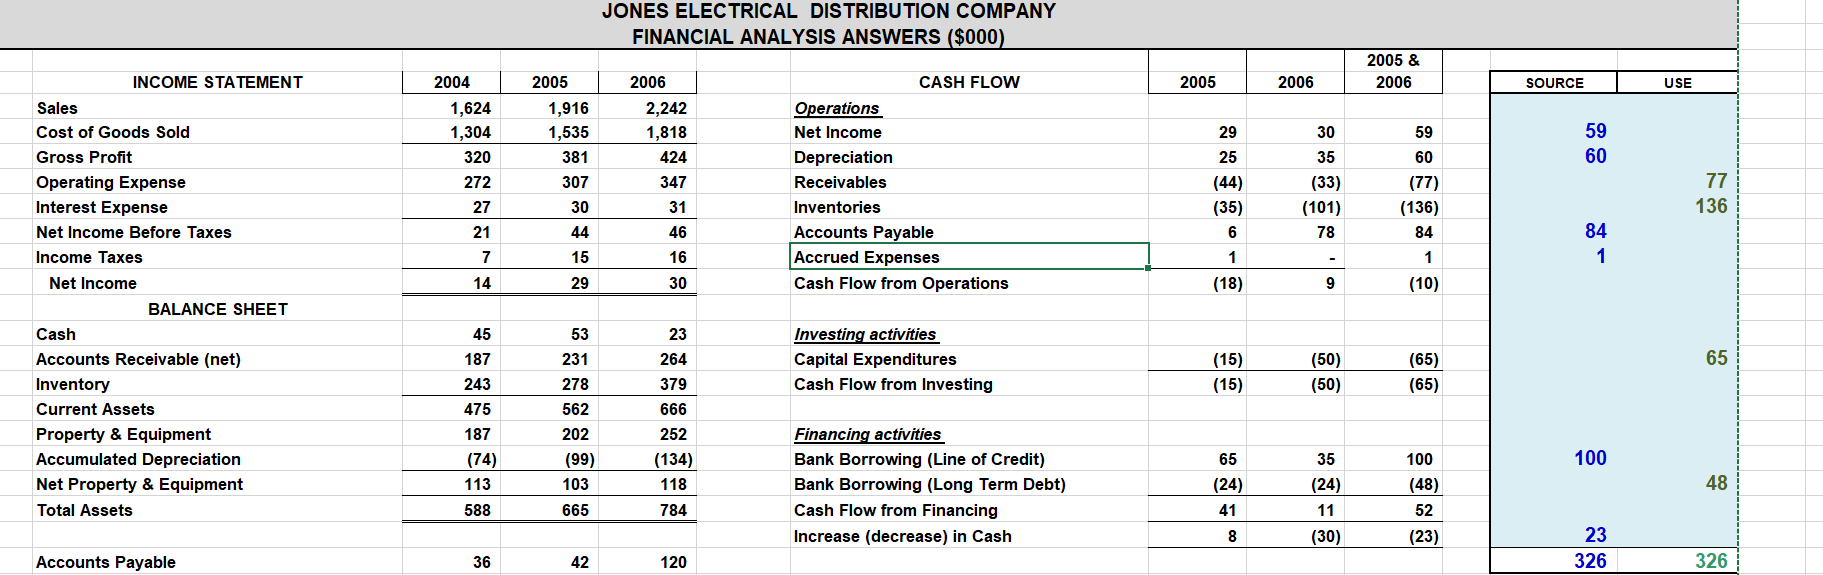
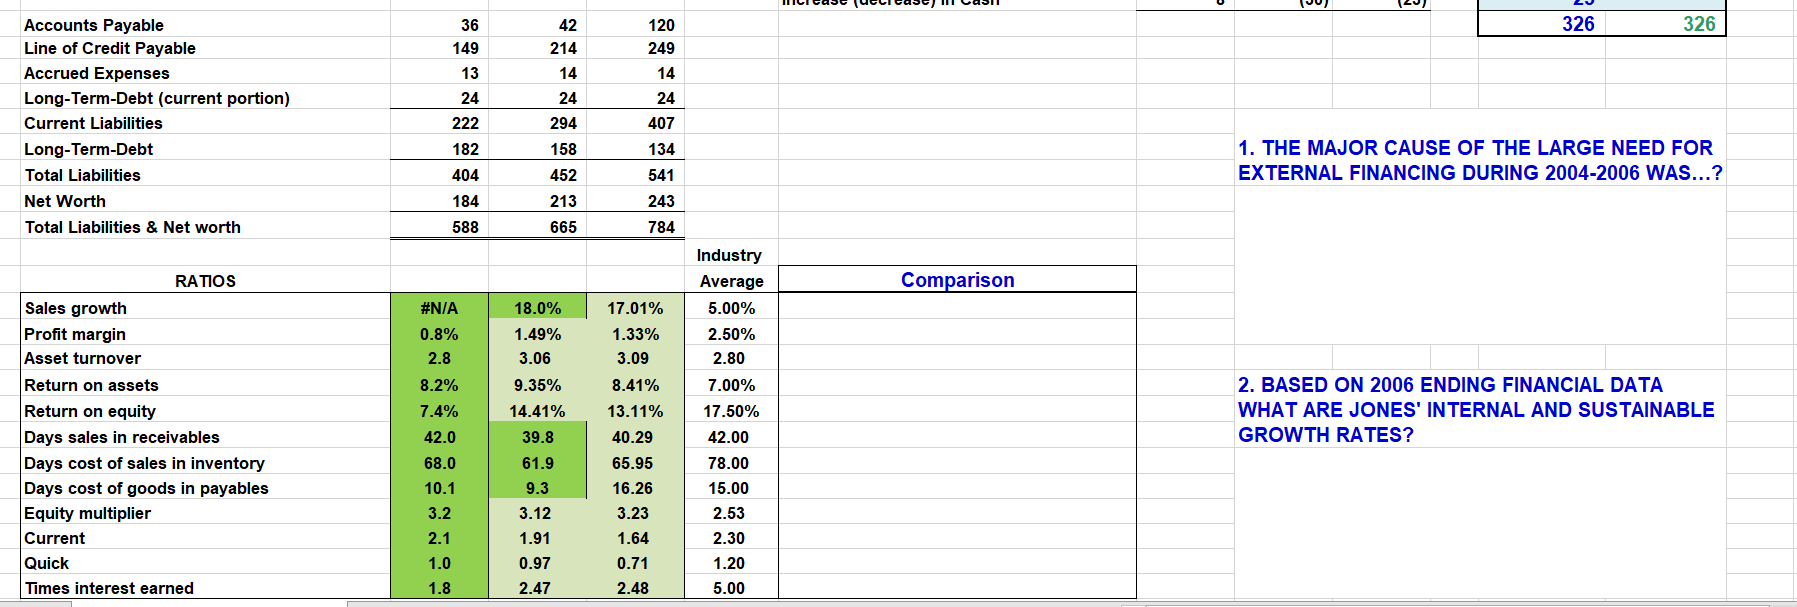
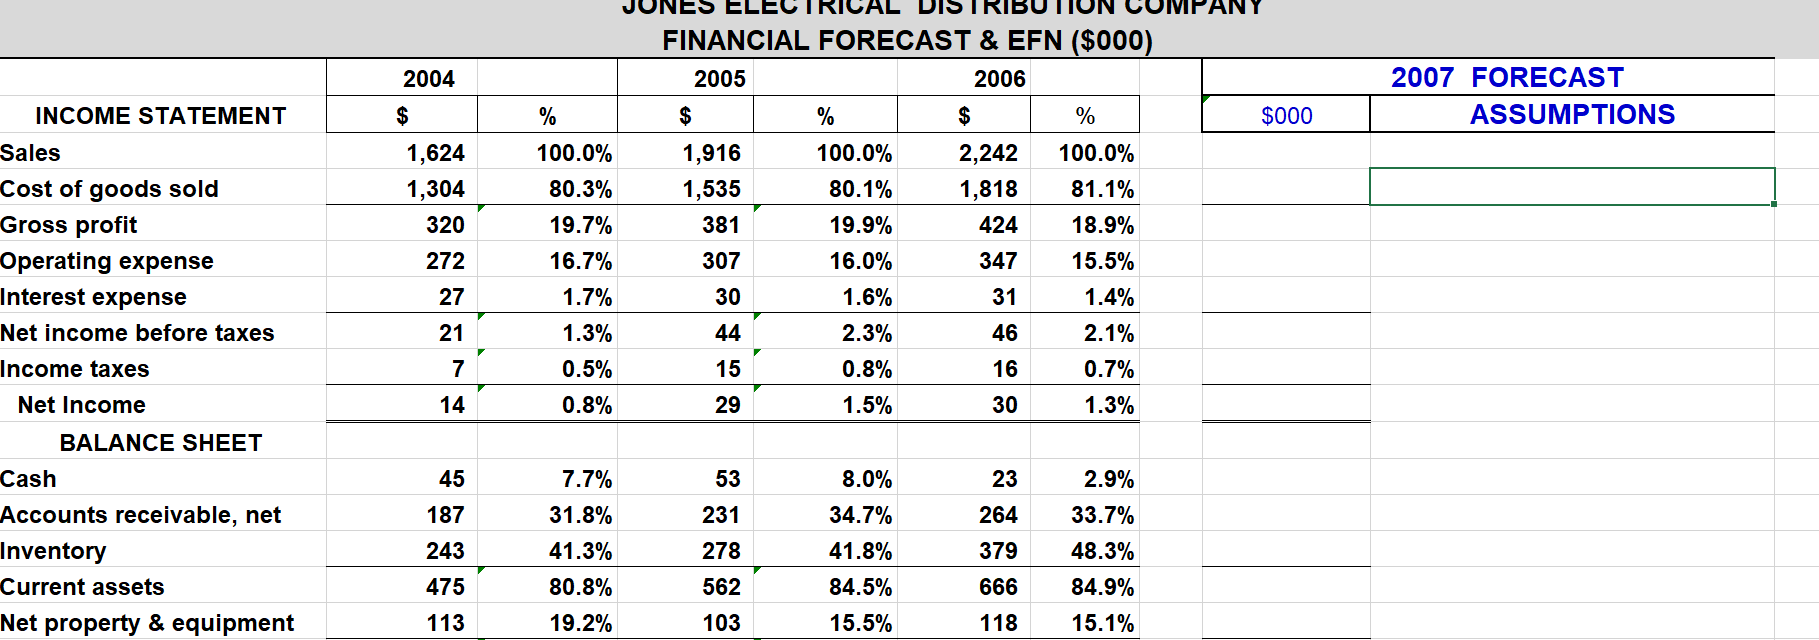
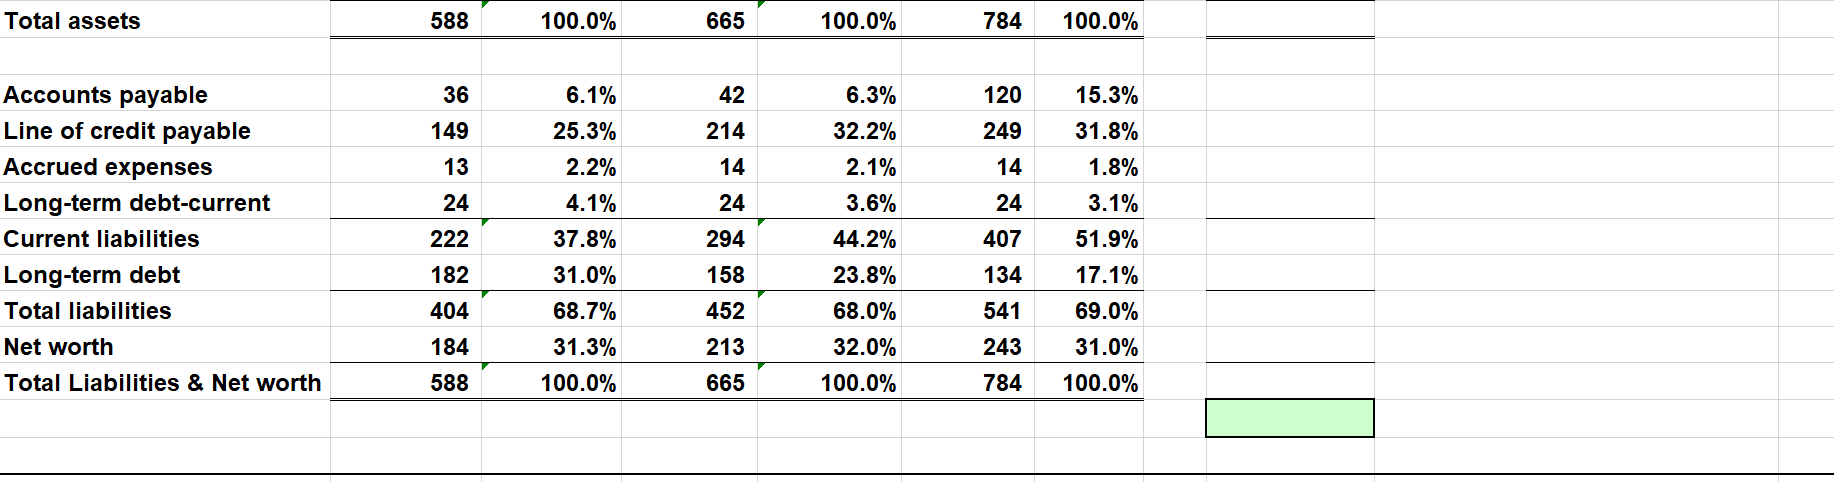
JONES ELECTRICAL DISTRIBUTION COMPANY FINANCIAL ANALYSIS ANSWERS ($000) 2005 & 2006 2005 2006 2005 2006 SOURCE USE 2004 1,624 1,304 320 272 29 59 1,916 1,535 381 307 30 2,242 1,818 424 347 59 60 25 60 CASH FLOW Operations Net Income Depreciation Receivables Inventories Accounts Payable Accrued Expenses Cash Flow from Operations (44) 30 35 (33) (101) 78 77 136 27 (35) 44 31 46 16 21 7 6 (77) (136) 84 1 (10) 84 1 15 1 (18) 14 29 30 9 INCOME STATEMENT Sales Cost of Goods Sold Gross Profit Operating Expense Interest Expense Net Income Before Taxes Income Taxes Net Income BALANCE SHEET Cash Accounts Receivable (net) Inventory Current Assets Property & Equipment Accumulated Depreciation Net Property & Equipment Total Assets 45 23 187 264 Investing activities Capital Expenditures Cash Flow from Investing (65) 53 231 278 562 65 (15) (15) (50) (50) (65) 243 475 187 (74) 113 588 202 (99) 379 666 252 (134) 118 784 65 100 100 103 Financing activities Bank Borrowing (Line of Credit) Bank Borrowing (Long Term Debt) Cash Flow from Financing Increase (decrease) in Cash (24) 48 35 (24) 11 (30) (48) 52 665 41 8 (23) 23 326 Accounts Payable 36 42 120 326 326 326 36 149 42 214 14 13 120 249 14 24 407 24 Accounts Payable Line of Credit Payable Accrued Expenses Long-Term-Debt (current portion) Current Liabilities Long-Term-Debt Total Liabilities Net Worth Total Liabilities & Net worth 24 222 294 158 134 182 404 184 1. THE MAJOR CAUSE OF THE LARGE NEED FOR EXTERNAL FINANCING DURING 2004-2006 WAS...? 452 213 665 541 243 784 588 Comparison #N/A 18.0% 1.49% 3.06 17.01% 1.33% 3.09 0.8% 2.8 8.2% 7.4% RATIOS Sales growth Profit margin Asset turnover Return on assets Return on equity Days sales in receivables Days cost of sale in inventory Days cost of goods in payables Equity multiplier Current Quick Times interest earned 2. BASED ON 2006 ENDING FINANCIAL DATA WHAT ARE JONES' INTERNAL AND SUSTAINABLE GROWTH RATES? Industry Average 5.00% 2.50% 2.80 7.00% 17.50% 42.00 78.00 15.00 2.53 2.30 1.20 5.00 42.0 68.0 9.35% 14.41% 39.8 61.9 9.3 3.12 1.91 0.97 2.47 10.1 8.41% 13.11% 40.29 65.95 16.26 3.23 1.64 0.71 2.48 3.2 2.1 1.0 1.8 ES IRIBU FINANCIAL FORECAST & EFN ($000) 2005 2006 2004 2007 FORECAST ASSUMPTIONS INCOME STATEMENT $ % $ $ % $000 1,624 1,304 320 1,916 1,535 2,242 1,818 424 347 381 272 307 % 100.0% 80.1% 19.9% 16.0% 1.6% 2.3% 0.8% 1.5% 100.0% 80.3% 19.7% 16.7% 1.7% 1.3% 0.5% 0.8% 100.0% 81.1% 18.9% 15.5% 1.4% 2.1% 0.7% 1.3% 27 30 31 21 44 Sales Cost of goods sold Gross profit Operating expense Interest expense Net income before taxes Income taxes Net Income BALANCE SHEET Cash Accounts receivable, net Inventory Current assets Net property & equipment 46 7 15 16 30 14 29 45 7.7% 53 8.0% 23 187 31.8% 231 34.7% 264 2.9% 33.7% 48.3% 84.9% 243 41.3% 278 379 41.8% 84.5% 475 80.8% 562 666 113 19.2% 103 15.5% 118 15.1% Total assets 588 100.0% 665 100.0% 784 100.0% 36 6.1% 42 120 15.3% 149 214 249 31.8% 13 14 14 24 24 24 Accounts payable Line of credit payable Accrued expenses Long-term debt-current Current liabilities Long-term debt Total liabilities Net worth Total Liabilities & Net worth 222 294 6.3% 32.2% 2.1% 3.6% 44.2% 23.8% 68.0% 32.0% 100.0% 25.3% 2.2% 4.1% 37.8% 31.0% 68.7% 31.3% 100.0% 407 1.8% 3.1% 51.9% 17.1% 69.0% 182 158 134 404 452 541 184 213 243 31.0% 588 665 784 100.0% JONES ELECTRICAL DISTRIBUTION COMPANY FINANCIAL ANALYSIS ANSWERS ($000) 2005 & 2006 2005 2006 2005 2006 SOURCE USE 2004 1,624 1,304 320 272 29 59 1,916 1,535 381 307 30 2,242 1,818 424 347 59 60 25 60 CASH FLOW Operations Net Income Depreciation Receivables Inventories Accounts Payable Accrued Expenses Cash Flow from Operations (44) 30 35 (33) (101) 78 77 136 27 (35) 44 31 46 16 21 7 6 (77) (136) 84 1 (10) 84 1 15 1 (18) 14 29 30 9 INCOME STATEMENT Sales Cost of Goods Sold Gross Profit Operating Expense Interest Expense Net Income Before Taxes Income Taxes Net Income BALANCE SHEET Cash Accounts Receivable (net) Inventory Current Assets Property & Equipment Accumulated Depreciation Net Property & Equipment Total Assets 45 23 187 264 Investing activities Capital Expenditures Cash Flow from Investing (65) 53 231 278 562 65 (15) (15) (50) (50) (65) 243 475 187 (74) 113 588 202 (99) 379 666 252 (134) 118 784 65 100 100 103 Financing activities Bank Borrowing (Line of Credit) Bank Borrowing (Long Term Debt) Cash Flow from Financing Increase (decrease) in Cash (24) 48 35 (24) 11 (30) (48) 52 665 41 8 (23) 23 326 Accounts Payable 36 42 120 326 326 326 36 149 42 214 14 13 120 249 14 24 407 24 Accounts Payable Line of Credit Payable Accrued Expenses Long-Term-Debt (current portion) Current Liabilities Long-Term-Debt Total Liabilities Net Worth Total Liabilities & Net worth 24 222 294 158 134 182 404 184 1. THE MAJOR CAUSE OF THE LARGE NEED FOR EXTERNAL FINANCING DURING 2004-2006 WAS...? 452 213 665 541 243 784 588 Comparison #N/A 18.0% 1.49% 3.06 17.01% 1.33% 3.09 0.8% 2.8 8.2% 7.4% RATIOS Sales growth Profit margin Asset turnover Return on assets Return on equity Days sales in receivables Days cost of sale in inventory Days cost of goods in payables Equity multiplier Current Quick Times interest earned 2. BASED ON 2006 ENDING FINANCIAL DATA WHAT ARE JONES' INTERNAL AND SUSTAINABLE GROWTH RATES? Industry Average 5.00% 2.50% 2.80 7.00% 17.50% 42.00 78.00 15.00 2.53 2.30 1.20 5.00 42.0 68.0 9.35% 14.41% 39.8 61.9 9.3 3.12 1.91 0.97 2.47 10.1 8.41% 13.11% 40.29 65.95 16.26 3.23 1.64 0.71 2.48 3.2 2.1 1.0 1.8 ES IRIBU FINANCIAL FORECAST & EFN ($000) 2005 2006 2004 2007 FORECAST ASSUMPTIONS INCOME STATEMENT $ % $ $ % $000 1,624 1,304 320 1,916 1,535 2,242 1,818 424 347 381 272 307 % 100.0% 80.1% 19.9% 16.0% 1.6% 2.3% 0.8% 1.5% 100.0% 80.3% 19.7% 16.7% 1.7% 1.3% 0.5% 0.8% 100.0% 81.1% 18.9% 15.5% 1.4% 2.1% 0.7% 1.3% 27 30 31 21 44 Sales Cost of goods sold Gross profit Operating expense Interest expense Net income before taxes Income taxes Net Income BALANCE SHEET Cash Accounts receivable, net Inventory Current assets Net property & equipment 46 7 15 16 30 14 29 45 7.7% 53 8.0% 23 187 31.8% 231 34.7% 264 2.9% 33.7% 48.3% 84.9% 243 41.3% 278 379 41.8% 84.5% 475 80.8% 562 666 113 19.2% 103 15.5% 118 15.1% Total assets 588 100.0% 665 100.0% 784 100.0% 36 6.1% 42 120 15.3% 149 214 249 31.8% 13 14 14 24 24 24 Accounts payable Line of credit payable Accrued expenses Long-term debt-current Current liabilities Long-term debt Total liabilities Net worth Total Liabilities & Net worth 222 294 6.3% 32.2% 2.1% 3.6% 44.2% 23.8% 68.0% 32.0% 100.0% 25.3% 2.2% 4.1% 37.8% 31.0% 68.7% 31.3% 100.0% 407 1.8% 3.1% 51.9% 17.1% 69.0% 182 158 134 404 452 541 184 213 243 31.0% 588 665 784 100.0%
Step by Step Solution
There are 3 Steps involved in it

Get step-by-step solutions from verified subject matter experts