

Question: Jse the following code in matlab: clear ; close all; data = load('ex1data1.txt'); % Dataset from Andrew Ng, Machine Learning MOOC X=data(:,1) y=data(:,2) plot(X, y,
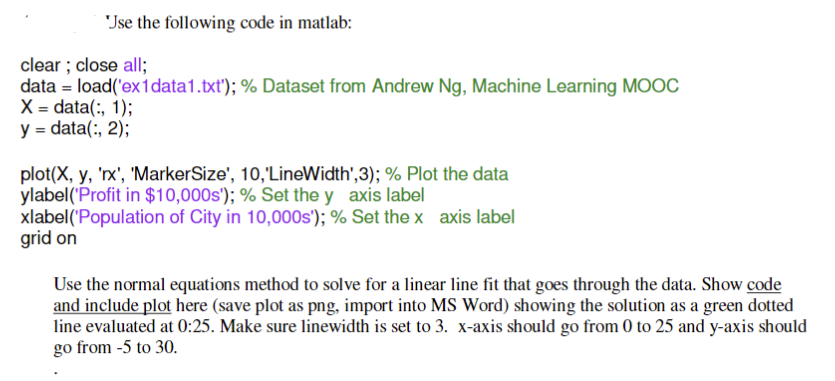
"Jse the following code in matlab: clear ; close all; data = load('ex1data1.txt'); \% Dataset from Andrew Ng, Machine Learning MOOC X=data(:,1) y=data(:,2) plot(X, y, 'rx', 'MarkerSize', 10,'LineWidth',3); \% Plot the data ylabel('Profit in $10,000 s'); \% Set the y axis label xlabel('Population of City in 10,000s'); % Set the x axis label grid on Use the normal equations method to solve for a linear line fit that goes through the data. Show code and include plot here (save plot as png, import into MS Word) showing the solution as a green dotted line evaluated at 0:25. Make sure linewidth is set to 3. x-axis should go from 0 to 25 and y-axis should go from 5 to 30
Step by Step Solution
There are 3 Steps involved in it

Get step-by-step solutions from verified subject matter experts