

Question: Juan needs to create a p-chart for a process. Juan takes 20 samples. Each sample is 200 units. Juan records a total of 27 defects.
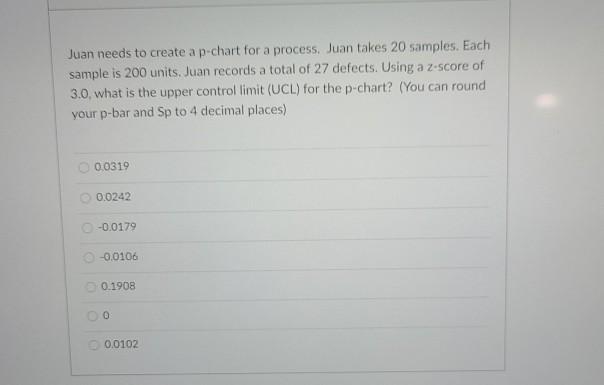
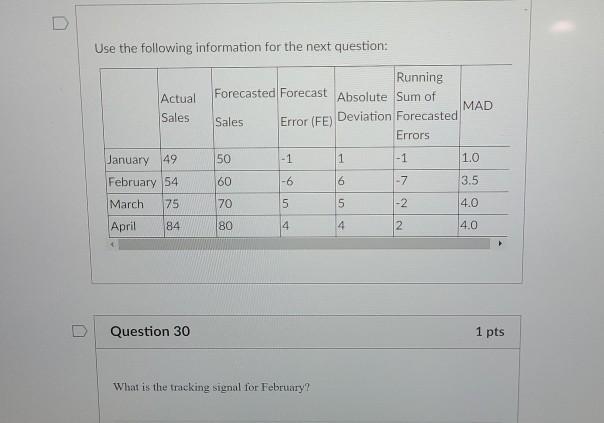
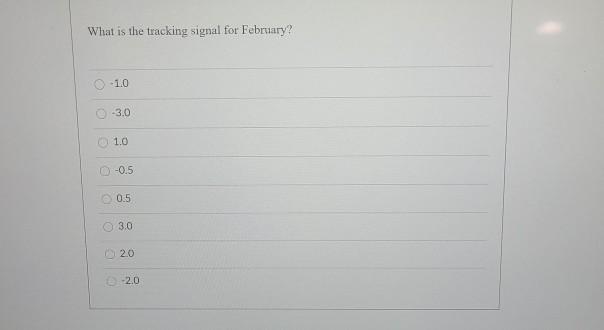
Juan needs to create a p-chart for a process. Juan takes 20 samples. Each sample is 200 units. Juan records a total of 27 defects. Using a z-score of 3.0, what is the upper controllimit (UCL) for the p-chart? (You can round your p-bar and Sp to 4 decimal places) 0.0319 0.0242 -0.0179 -0.0106 0.1908 0.0102 D Use the following information for the next question: Actual Sales Running Forecasted Forecast Absolute Sum of MAD Sales Error (FE) Deviation Forecasted Errors 50 -1 1 -1 1.0 January 49 February 54 60 -6 6 -7 3.5 March 75 70 5 5 -2 4.0 April 84 80 4 4 2 4.0 Question 30 1 pts What is the tracking signal for February? What is the tracking signal for February? -1.0 -3.0 1.0 -0.5 0.5 3.0 20 -2.0
Step by Step Solution
There are 3 Steps involved in it
1 Expert Approved Answer
Step: 1 Unlock

Question Has Been Solved by an Expert!
Get step-by-step solutions from verified subject matter experts
Step: 2 Unlock
Step: 3 Unlock