

Question: Jump to level 1 Create scatterplots using the data in the spreadsheet linked above, adjust the range of values in the horizontal and vertical axes,
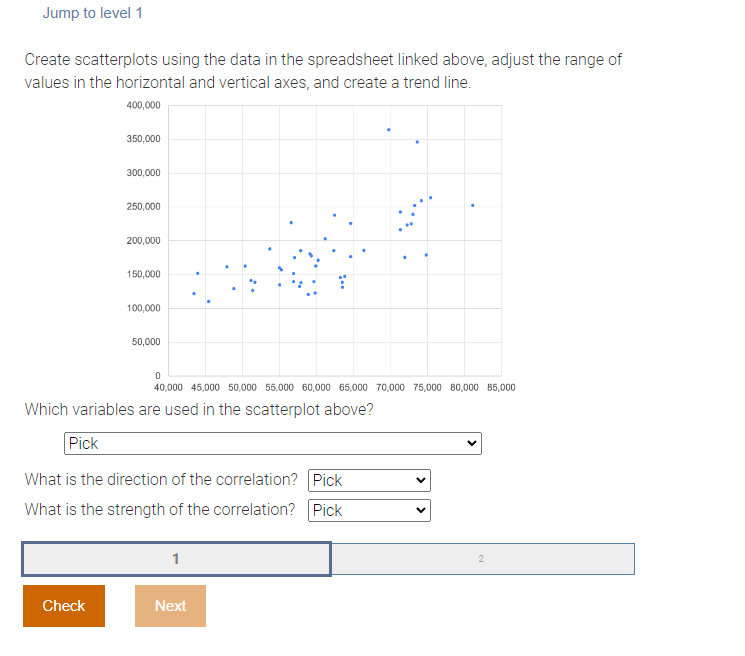
Jump to level 1 Create scatterplots using the data in the spreadsheet linked above, adjust the range of values in the horizontal and vertical axes, and create a trend line. 400,000 350,000 300,0DO 250,000 200,000 150,000 100,000 50,000 0 40,000 45,000 50,000 55,000 60,000 65,000 70,000 75,000 80,000 85,000 Which variables are used in the scatterplot above? Pick What is the direction of the correlation? Pick What is the strength of the correlation? Pick 2 Check Next
Step by Step Solution
There are 3 Steps involved in it
1 Expert Approved Answer
Step: 1 Unlock

Question Has Been Solved by an Expert!
Get step-by-step solutions from verified subject matter experts
Step: 2 Unlock
Step: 3 Unlock