

Question: Jump to level 1 The following box plot represents a sample of house prices. 2 House prices ($1000s) 3 160 155 Find and interpret the
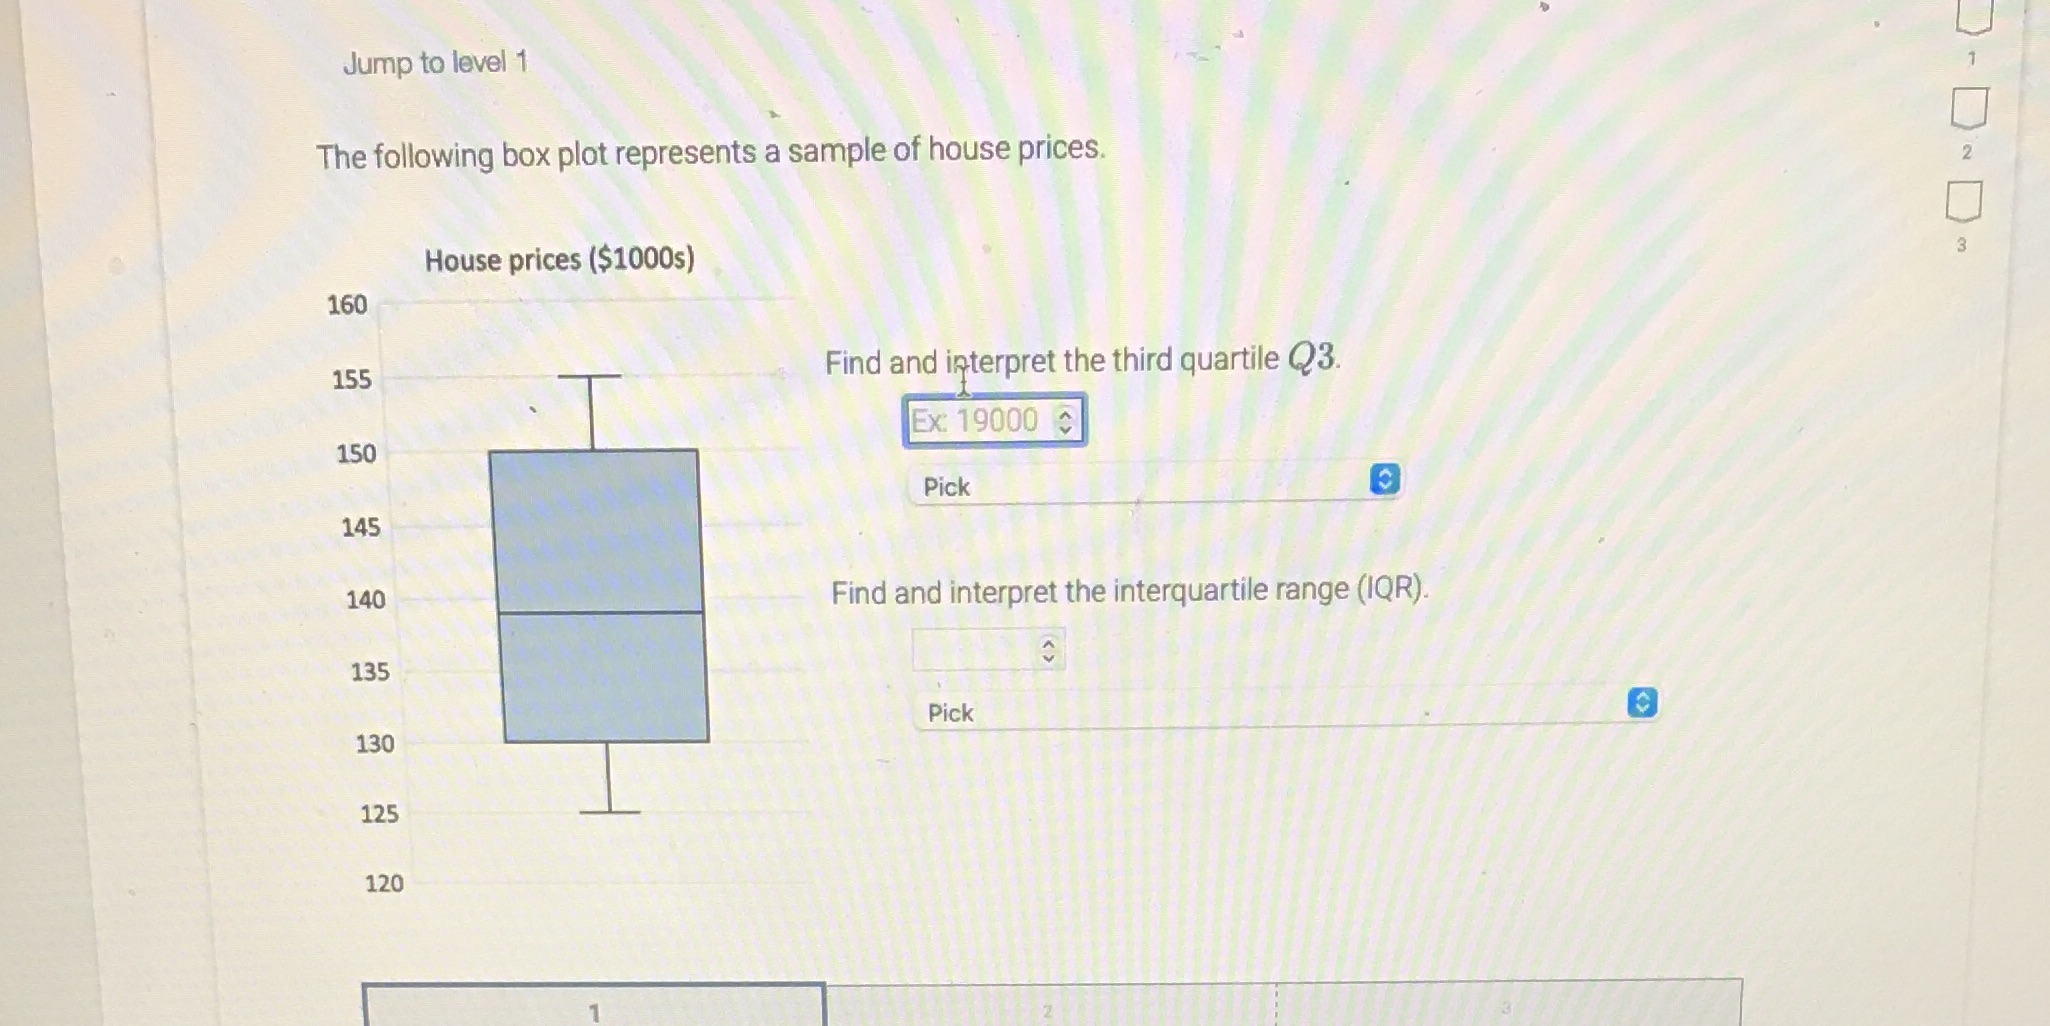
Jump to level 1 The following box plot represents a sample of house prices. 2 House prices ($1000s) 3 160 155 Find and interpret the third quartile Q3. EX: 19000 150 Pick 145 140 Find and interpret the interquartile range (IQR). 135 Pick 130 125 120
Step by Step Solution
There are 3 Steps involved in it
1 Expert Approved Answer
Step: 1 Unlock

Question Has Been Solved by an Expert!
Get step-by-step solutions from verified subject matter experts
Step: 2 Unlock
Step: 3 Unlock