

Question: Ju.n 2018 QUESTION 4 The following frequency table shows the weight of 60 obese workers in Company A. Weight (kg) Number of Workers 90 -
Ju.n 2018
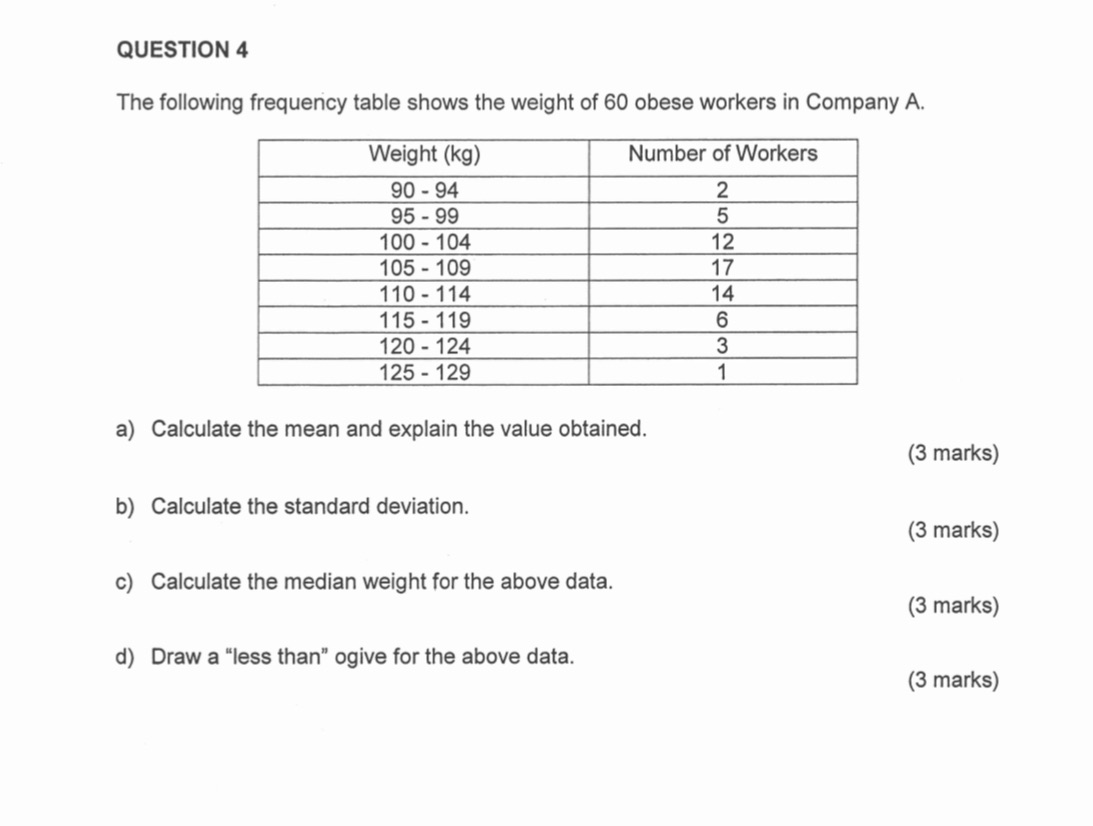
QUESTION 4 The following frequency table shows the weight of 60 obese workers in Company A. Weight (kg) Number of Workers 90 - 94 N 95 - 99 5 100 - 104 12 105 - 109 17 110 - 114 14 115 - 119 6 120 - 124 3 125 - 129 1 a) Calculate the mean and explain the value obtained. (3 marks) b) Calculate the standard deviation. (3 marks) c) Calculate the median weight for the above data. (3 marks) d) Draw a "less than" ogive for the above data
Step by Step Solution
There are 3 Steps involved in it
1 Expert Approved Answer
Step: 1 Unlock

Question Has Been Solved by an Expert!
Get step-by-step solutions from verified subject matter experts
Step: 2 Unlock
Step: 3 Unlock