

Question: Just finished the work, could you check them for correctness? Use the following to answer the multiple questions below. A manufacturer of children's toys perform
Just finished the work, could you check them for correctness?
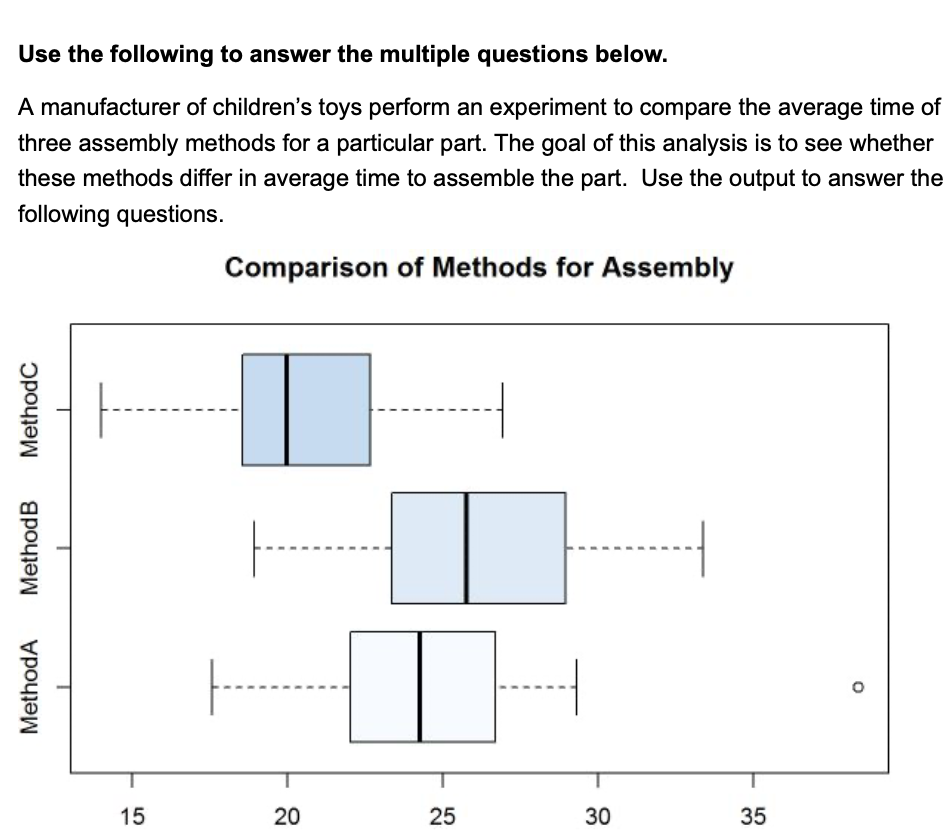
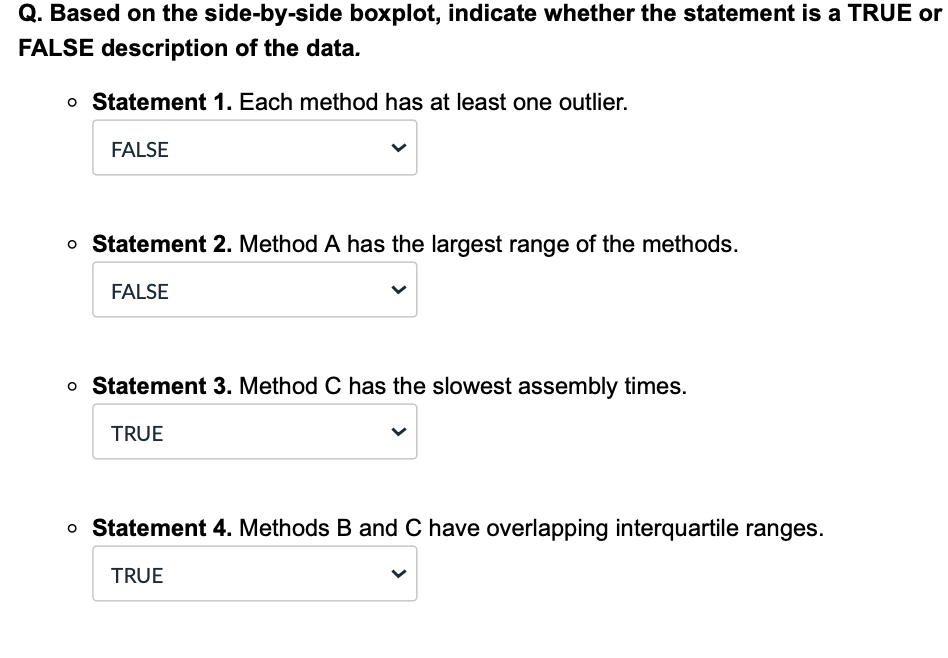
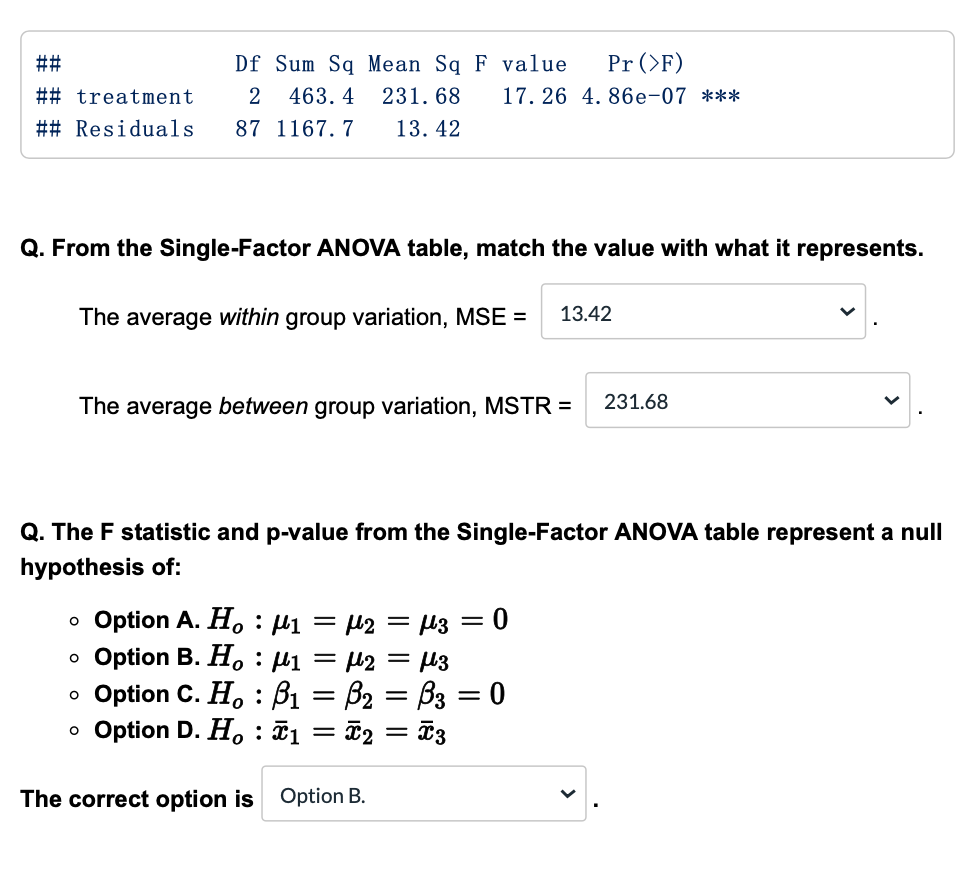
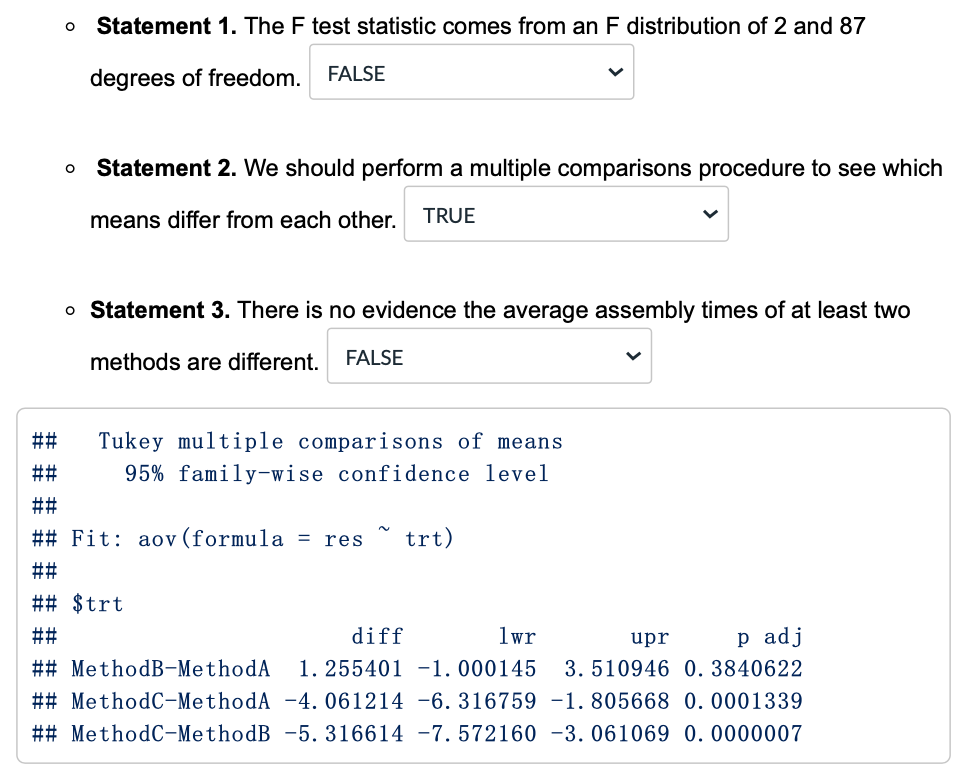
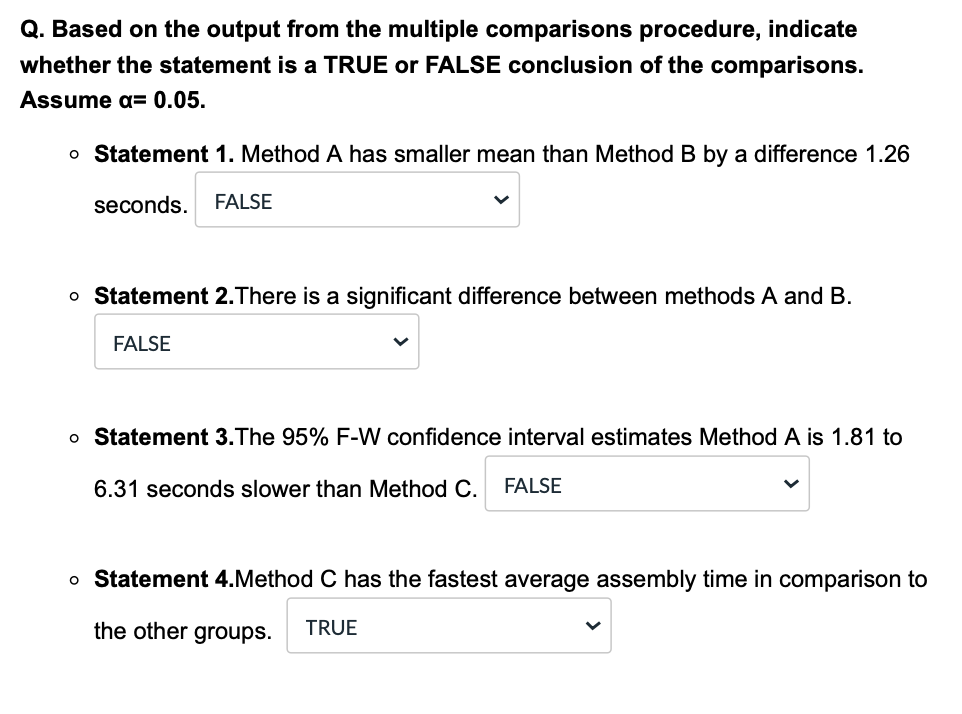
Use the following to answer the multiple questions below. A manufacturer of children's toys perform an experiment to compare the average time of three assembly methods for a particular part. The goal of this analysis is to see whether these methods differ in average time to assemble the part. Use the output to answer the following questions. Comparison of Methods for Assembly MethodB MethodC MethodA 15 20 25 30 35 0. Based on the side-by-side boxplot, indicate whether the statement is a TRUE or FALSE description of the data. 0 Statement 1. Each method has at least one outlier. FALSE V 0 Statement 2. Method A has the largest range of the methods. FALSE V 0 Statement 3. Method C has the slowest assembly times. TRUE V 0 Statement 4. Methods B and C have overlapping interquartile ranges. TRUE V # # Df Sum Sq Mean Sq F value Pr ()F) treatment 2 463. 4 231. 68 17. 26 4. 86e-07 *** ## Residuals 87 1167. 7 13. 42 Q. From the Single-Factor ANOVA table, match the value with what it represents. The average within group variation, MSE = 13.42 The average between group variation, MSTR = 231.68 Q. The F statistic and p-value from the Single-Factor ANOVA table represent a null hypothesis of: o Option A. Ho : /1 = /2 = /3 = 0 o Option B. H. : /1 = /2 = /3 o Option C. Ho : B1 = B2 = B3 = 0 o Option D. H. : $1 = $2 = 23 The correct option is Option B.Q. Based on the F test statistic and p-value from the Single-Factor ANOVA table, indicate whether the statement is a TRUE or FALSE conclusion of the test.. Statement 1. The F test statistic comes from an F distribution of 2 and 87 degrees of freedom. FALSE o Statement 2. We should perform a multiple comparisons procedure to see which means differ from each other. TRUE o Statement 3. There is no evidence the average assembly times of at least two methods are different. FALSE ## Tukey multiple comparisons of means 95% family-wise confidence level # # Fit: aov (formula = res ~ trt) # # # # $trt diff 1wr upr p adj # # MethodB-MethodA 1. 255401 -1. 000145 3. 510946 0. 3840622 ## MethodC-MethodA -4. 061214 -6. 316759 -1. 805668 0. 0001339 ## MethodC-MethodB -5. 316614 -7. 572160 -3. 061069 0. 00000070. Based on the output from the multiple comparisons procedure, indicate whether the statement is a TRUE or FALSE conclusion of the comparisons. Assume o= 0.05. 0 Statement 1. Method A has smaller mean than Method B by a difference 1.26 seconds. FALSE V 0 Statement 2.There is a signicant difference between methods A and B. FALSE V 0 Statement 3.The 95% F-W condence interval estimates Method A is 1.81 to 6.31 seconds slower than Method C. FALSE v 0 Statement 4.Method C has the fastest average assembly time in comparison to the other groups. TRUE v
Step by Step Solution
There are 3 Steps involved in it

Get step-by-step solutions from verified subject matter experts