

Question: Just need 1.3 please. Data Provided 1.1 The first thing you need to do is calculate the returns for the market index and your stock.
Just need 1.3 please. Data Provided
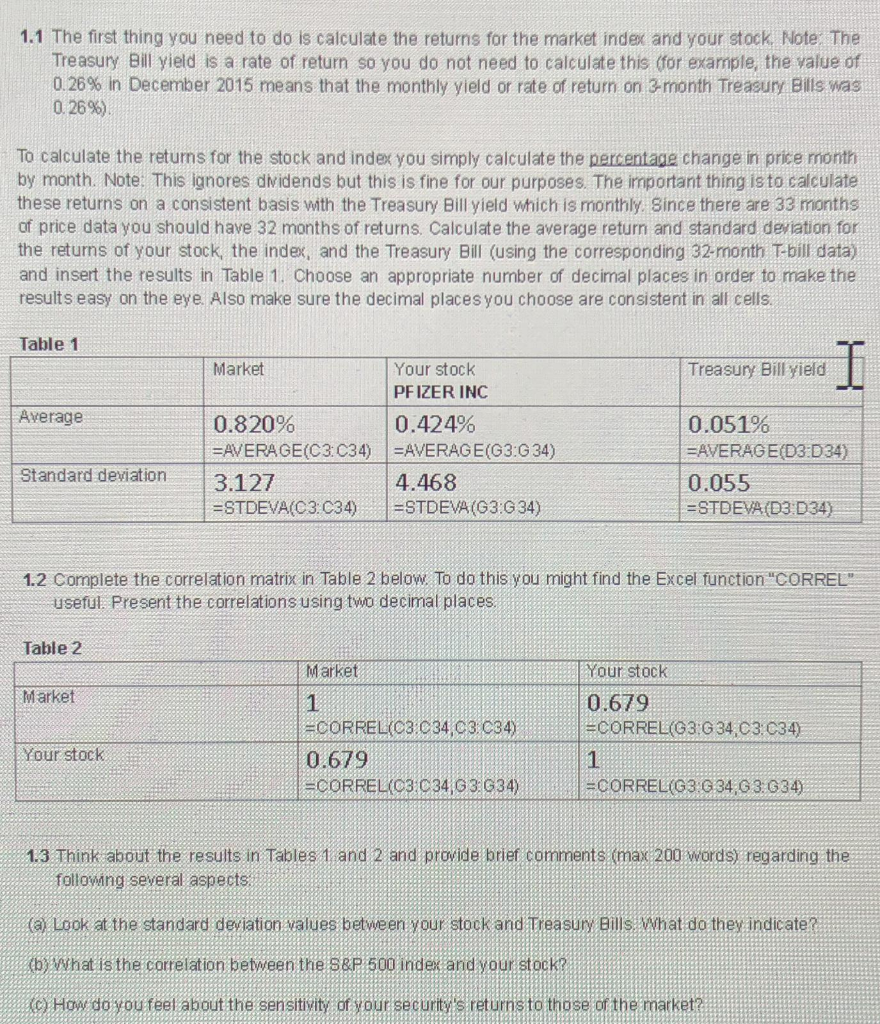
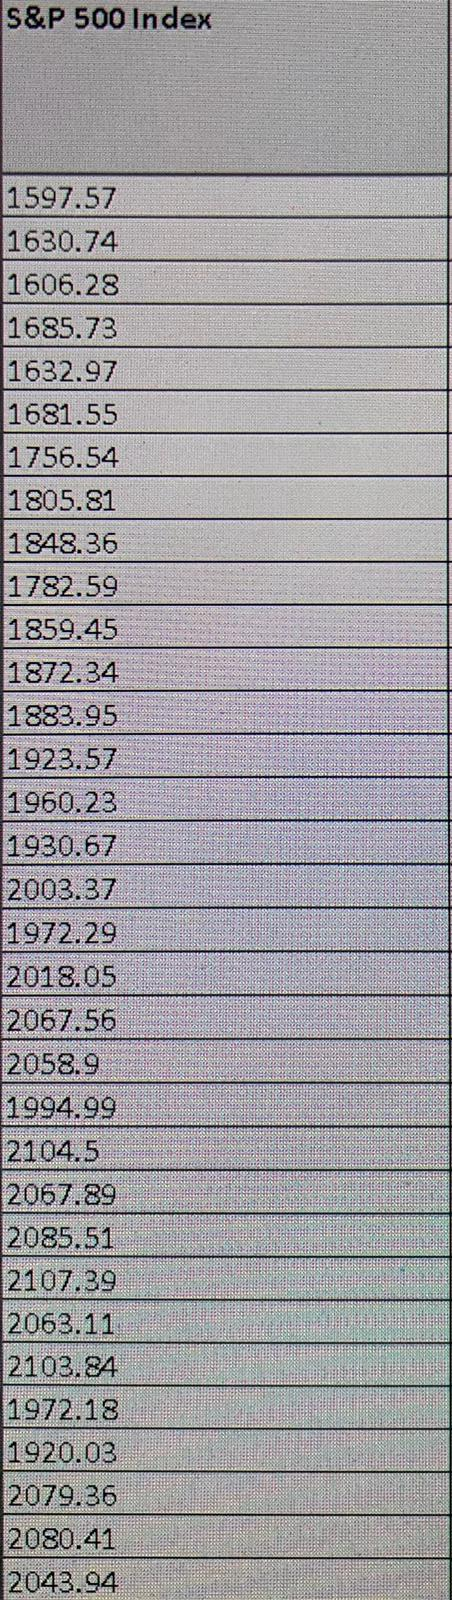
1.1 The first thing you need to do is calculate the returns for the market index and your stock. Note: The Treasury Bill yield is a rate of return so you do not need to calculate this (for example, the value of 0.26% in December 2015 means that the monthly yield or rate of return on 3-month Treasury Bills was 0.26%) To calculate the returns for the stock and index you simply calculate the percentage change in price month by month. Note: This ignores dividends but this is fine for our purposes. The important thing is to calculate these returns on a consistent basis with the Treasury Bill yield which is monthly. Since there are 33 months of price data you should have 32 months of returns. Calculate the average return and standard deviation for the returns of your stock, the index and the Treasury Bill (using the corresponding 32-month T-bill data) and insert the results in Table 1. Choose an appropriate number of decimal places in order to make the results easy on the eye. Also make sure the decimal places you choose are consistent in all cells. Table 1 Market Treasury Bill yield: Average Your stock PFIZER INC 0.424% =AVERAGE(G3:G 34) 4.468 =STDEVA (G3:G34) 0.820% EAVERAGE(C3: C34) 3.127 =STDEVA(C3:C34) Standard deviation 0.051% =AVERAGE(D3 D34) 0.055 = STDEVA (D3 D34) 1.2 Complete the correlation matrix in Table 2 below. To do this you might find the Excel function "CORREL". useful. Present the correlations using two decimal places. Table 2 Market Market | Your stock 0.679 =CORREL(G3:G 34,C3:C34) | Your stock =CORREL(C3 C34,C3: C34) 0.679 =CORREL(C3.C 34,G3 G34) =CORREL(G3 G34,3.G34) 1.3 Think about the results in Tables 1 and 2 and provide brief comments (max 200 words) regarding the followng several aspects: (a) Look at the standard deviation values between your stock and Treasury Bills. What do they indicate? (b) What is the correlation between the S&P 500 index and your stock? (c) How do you feel about the sensitivity of your security's returns to those of the market S&P 500 Index 926 1597.57 1630.74 1606.28 1685.73 1632.97 1681.55 1756.54 1805.81 1848.36 1782.59 1859.45 1872.34 1883.95 1923.57 1960.23 1930.67 2003.37 1972.29 2018.05 2067.56 2058.9 1994.99 2104.5 2067.89 2085.51 2107.39 2063.11 2103.84 1972.18 1920.03 2079.36 2080.41 2043.94
Step by Step Solution
There are 3 Steps involved in it

Get step-by-step solutions from verified subject matter experts