

Question: Just need help completing g, h, i, and m Here are simplified financial statements for Phone Corporation in a recent year: INCOME STATEMENT (Figures in
Just need help completing g, h, i, and m
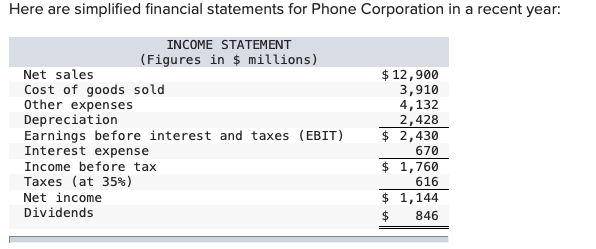
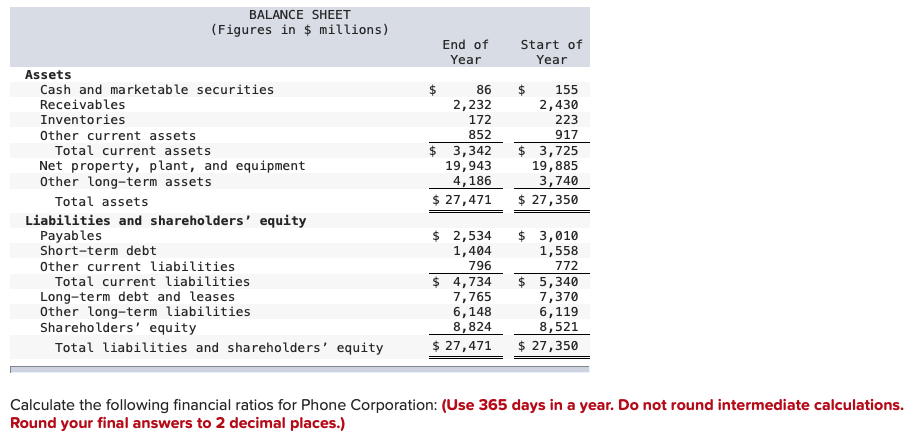
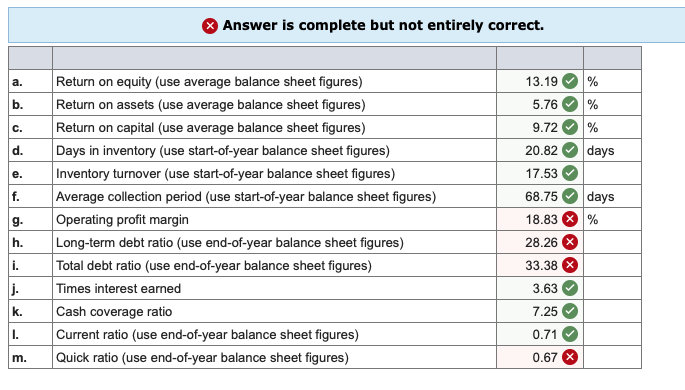
Here are simplified financial statements for Phone Corporation in a recent year: INCOME STATEMENT (Figures in $ millions) Net sales Cost of goods sold Other expenses Depreciation Earnings before interest and taxes (EBIT) Interest expense Income before tax Taxes (at 35%) Net income Dividends $ 12,900 3,910 4,132 2,428 $ 2,430 670 $ 1,760 616 $ 1,144 $ 846 BALANCE SHEET (Figures in $ millions) End of Year Start of Year 86 2,232 172 852 $ 3,342 19,943 4,186 $ 27,471 $ 155 2,430 223 917 $ 3,725 19,885 3,740 $ 27,350 Assets Cash and marketable securities Receivables Inventories Other current assets Total current assets Net property, plant, and equipment Other long-term assets Total assets Liabilities and shareholders' equity Payables Short-term debt Other current liabilities Total current liabilities Long-term debt and leases Other long-term liabilities Shareholders' equity Total liabilities and shareholders' equity $ 2,534 1,404 796 $ 4,734 7,765 6,148 8,824 $ 27,471 $ 3,010 1,558 772 $ 5,340 7,370 6,119 8,521 $ 27,350 Calculate the following financial ratios for Phone Corporation: (Use 365 days in a year. Do not round intermediate calculations. Round your final answers to 2 decimal places.) Answer is complete but not entirely correct. a. 13.19 5.76 b. % % % days c. 9.72 d. e. 20.82 17.53 68.75 18.83 00 f. days Return on equity (use average balance sheet figures) Return on assets (use average balance sheet figures) Return on capital (use average balance sheet figures) Days in inventory (use start-of-year balance sheet figures) Inventory turnover (use start-of-year balance sheet figures) Average collection period (use start-of-year balance sheet figures) Operating profit margin Long-term debt ratio (use end-of-year balance sheet figures) Total debt ratio (use end-of-year balance sheet figures) Times interest earned Cash coverage ratio Current ratio (use end-of-year balance sheet figures) Quick ratio (use end-of-year balance sheet figures) g. h. 28.26 i. 33.38 X . k. 3.63 7.25 0.71 I. m. 0.67
Step by Step Solution
There are 3 Steps involved in it

Get step-by-step solutions from verified subject matter experts