

Question: Just Need help figuring out the Formulas. Thank you. The Inventory spreadsheet has data on the products our company sells. The columns have the following
Just Need help figuring out the Formulas. Thank you.
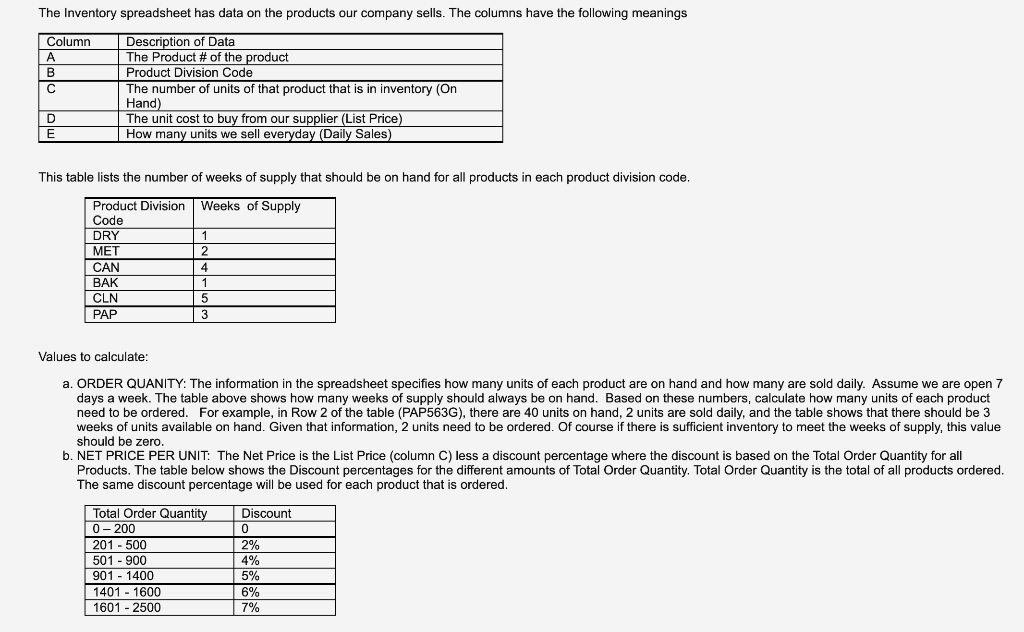
The Inventory spreadsheet has data on the products our company sells. The columns have the following meanings Column A B Description of Data The Product # of the product Product Division Code The number of units of that product that is in inventory (On Hand) The unit cost to buy from our supplier (List Price) How many units we sell everyday (Daily Sales) D E This table lists the number of weeks of supply that should be on hand for all products in each product division code. Weeks of Supply Product Division Code DRY MET CAN BAK CLN PAP 1 2 4 1 5 3 Values to calculate: a. ORDER QUANITY: The information in the spreadsheet specifies how many units of each product are on hand and how many are sold daily. Assume we are open 7 days a week. The table above shows how many weeks of supply should always be on hand. Based on these numbers, calculate how many units of each product need to be ordered. For example, in Row 2 of the table (PAP563G), there are 40 units on hand, 2 units are sold daily, and the table shows that there should be 3 weeks of units available on hand. Given that information, 2 units need to be ordered. Of course if there is sufficient inventory to meet the weeks of supply, this value should be zero. b. NET PRICE PER UNIT: The Net Price is the List Price (column C) less a discount percentage where the discount is based on the Total Order Quantity for all Products. The table below shows the Discount percentages for the different amounts of Total Order Quantity. Total Order Quantity is the total of all products ordered. The same discount percentage will be used for each product that is ordered. Total Order Quantity 0 - 200 201 - 500 501 - 900 901 - 1400 1401 - 1600 1601 - 2500 Discount 0 2% 4% 5% 6% 7% The Inventory spreadsheet has data on the products our company sells. The columns have the following meanings Column A B Description of Data The Product # of the product Product Division Code The number of units of that product that is in inventory (On Hand) The unit cost to buy from our supplier (List Price) How many units we sell everyday (Daily Sales) D E This table lists the number of weeks of supply that should be on hand for all products in each product division code. Weeks of Supply Product Division Code DRY MET CAN BAK CLN PAP 1 2 4 1 5 3 Values to calculate: a. ORDER QUANITY: The information in the spreadsheet specifies how many units of each product are on hand and how many are sold daily. Assume we are open 7 days a week. The table above shows how many weeks of supply should always be on hand. Based on these numbers, calculate how many units of each product need to be ordered. For example, in Row 2 of the table (PAP563G), there are 40 units on hand, 2 units are sold daily, and the table shows that there should be 3 weeks of units available on hand. Given that information, 2 units need to be ordered. Of course if there is sufficient inventory to meet the weeks of supply, this value should be zero. b. NET PRICE PER UNIT: The Net Price is the List Price (column C) less a discount percentage where the discount is based on the Total Order Quantity for all Products. The table below shows the Discount percentages for the different amounts of Total Order Quantity. Total Order Quantity is the total of all products ordered. The same discount percentage will be used for each product that is ordered. Total Order Quantity 0 - 200 201 - 500 501 - 900 901 - 1400 1401 - 1600 1601 - 2500 Discount 0 2% 4% 5% 6% 7%Step by Step Solution
There are 3 Steps involved in it
1 Expert Approved Answer
Step: 1 Unlock

Question Has Been Solved by an Expert!
Get step-by-step solutions from verified subject matter experts
Step: 2 Unlock
Step: 3 Unlock