

Question: just need to know how to do the graphs. Use the supply and demand information in the table below to answer the following questions. Price
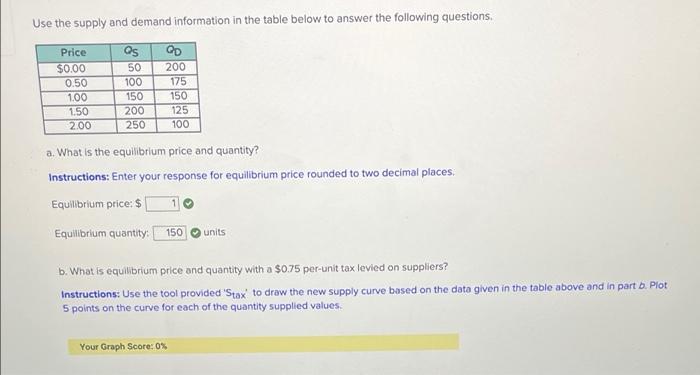
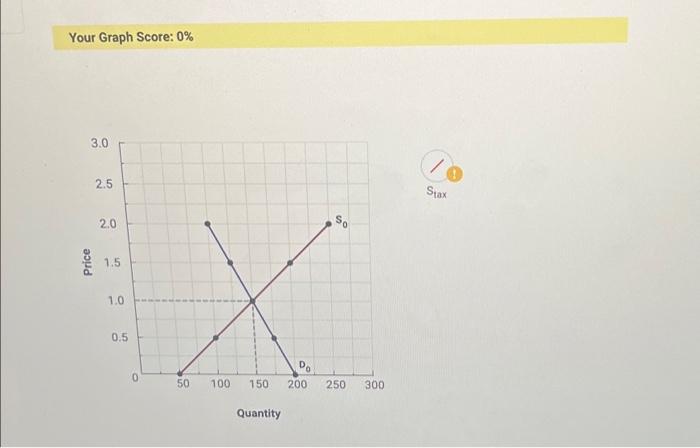
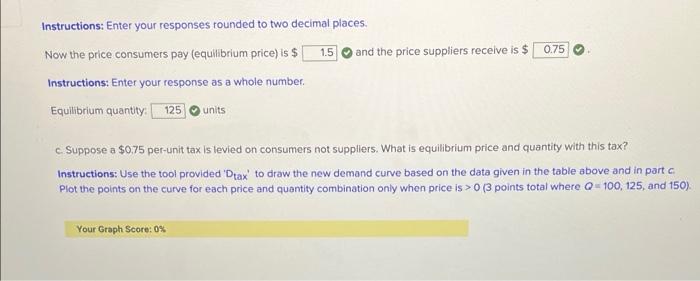
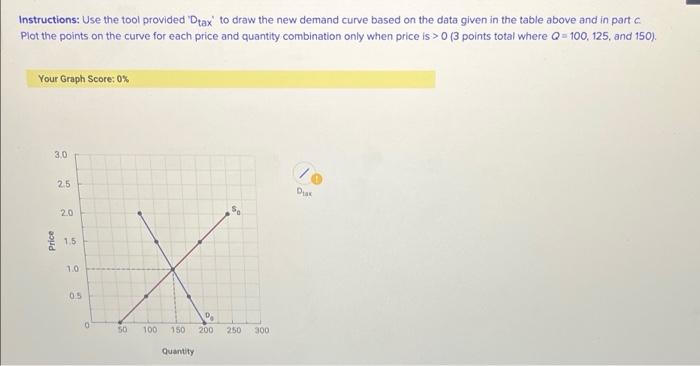
Use the supply and demand information in the table below to answer the following questions. Price $0.00 0.50 1.00 150 2.00 50 100 150 200 250 GD 200 175 150 125 100 a. What is the equilibrium price and quantity? Instructions: Enter your response for equilibrium price rounded to two decimal places. Equilibrium price: $ 1 Equilibrium quantity: 150 units b. What is equilibrium price and quantity with a $0.75 per-unit tax levied on suppliers? Instructions: Use the tool provided 'Stax to draw the new supply curve based on the data given in the table above and in parto. Plot 5 points on the curve for each of the quantity supplied values. Your Graph Score: 0% Your Graph Score: 0% 3.0 10 2.5 Stax 2.0 $ Price 1.5 1.0 0.5 Do 0 50 100 150 200 250 300 Quantity 0.75 Instructions: Enter your responses rounded to two decimal places. Now the price consumers pay (equilibrium price) is $ 1.5 and the price suppliers receive is $ Instructions: Enter your response as a whole number, Equilibrium quantity: 125 units c Suppose a $0,75 per-unit tax is levied on consumers not suppliers. What is equilibrium price and quantity with this tax? Instructions: Use the tool provided Drax to draw the new demand curve based on the data given in the toble above and in part a Plot the points on the curve for each price and quantity combination only when price is > 0 (3 points total where Q-100, 125, and 150). Your Graph Score: 0% Instructions: Use the tool provided Dtax to draw the new demand curve based on the data given in the table above and in part a Plot the points on the curve for each price and quantity combination only when price is> 0 (3 points total where Q = 100, 125, and 150). Your Graph Score: 0% 3.0 25 D 2.0 5 Price 15 1.0 05 0 56 100 150 200 250 300 Quantity
Step by Step Solution
There are 3 Steps involved in it

Get step-by-step solutions from verified subject matter experts