

Question: JUST NEED TO KNOW INPUTS TO FIND THE NPV VALUES ON EXCEL. NEED BY 12 PM CST IF POSSIBLE. B M N 0 3 Complete
JUST NEED TO KNOW INPUTS TO FIND THE NPV VALUES ON EXCEL. NEED BY 12 PM CST IF POSSIBLE.
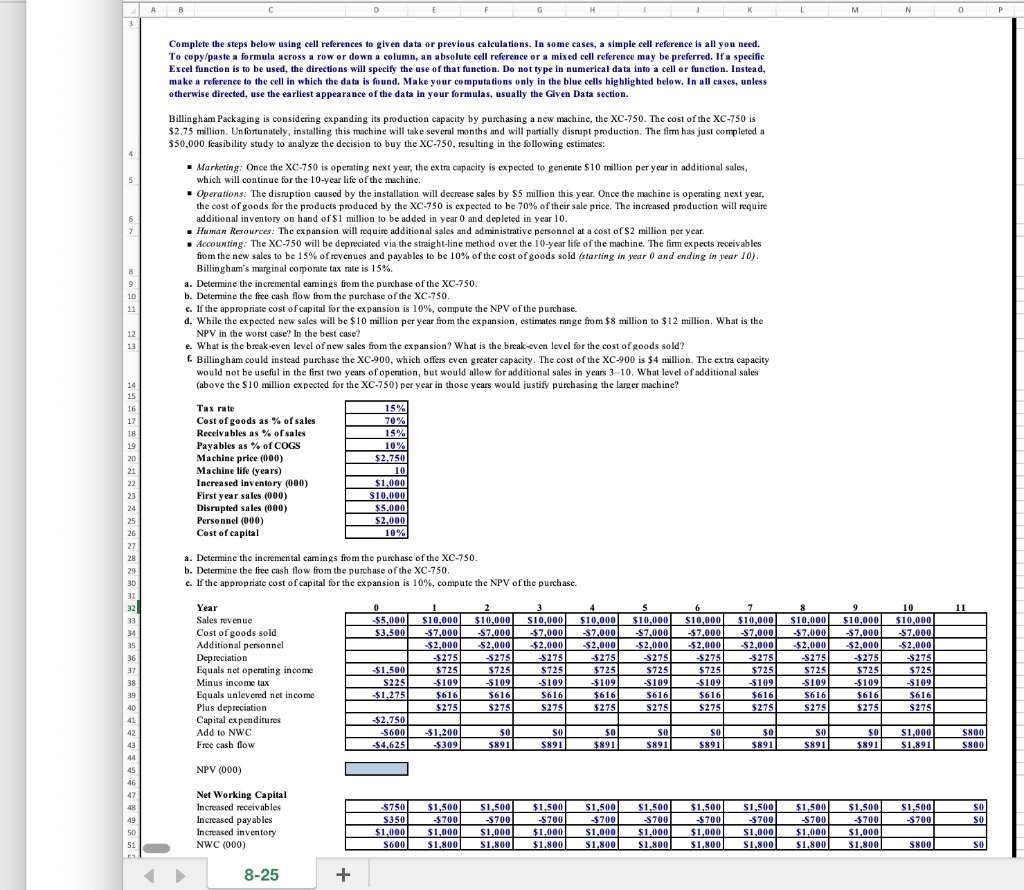
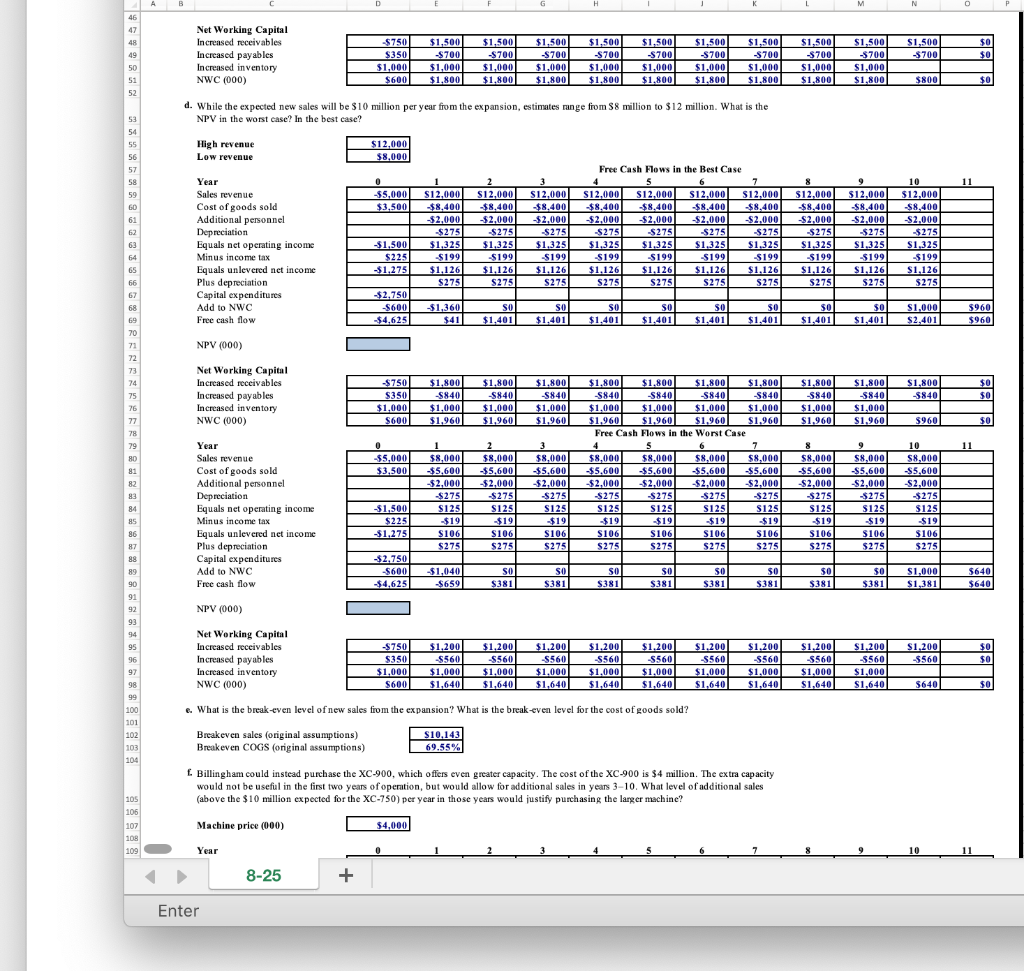
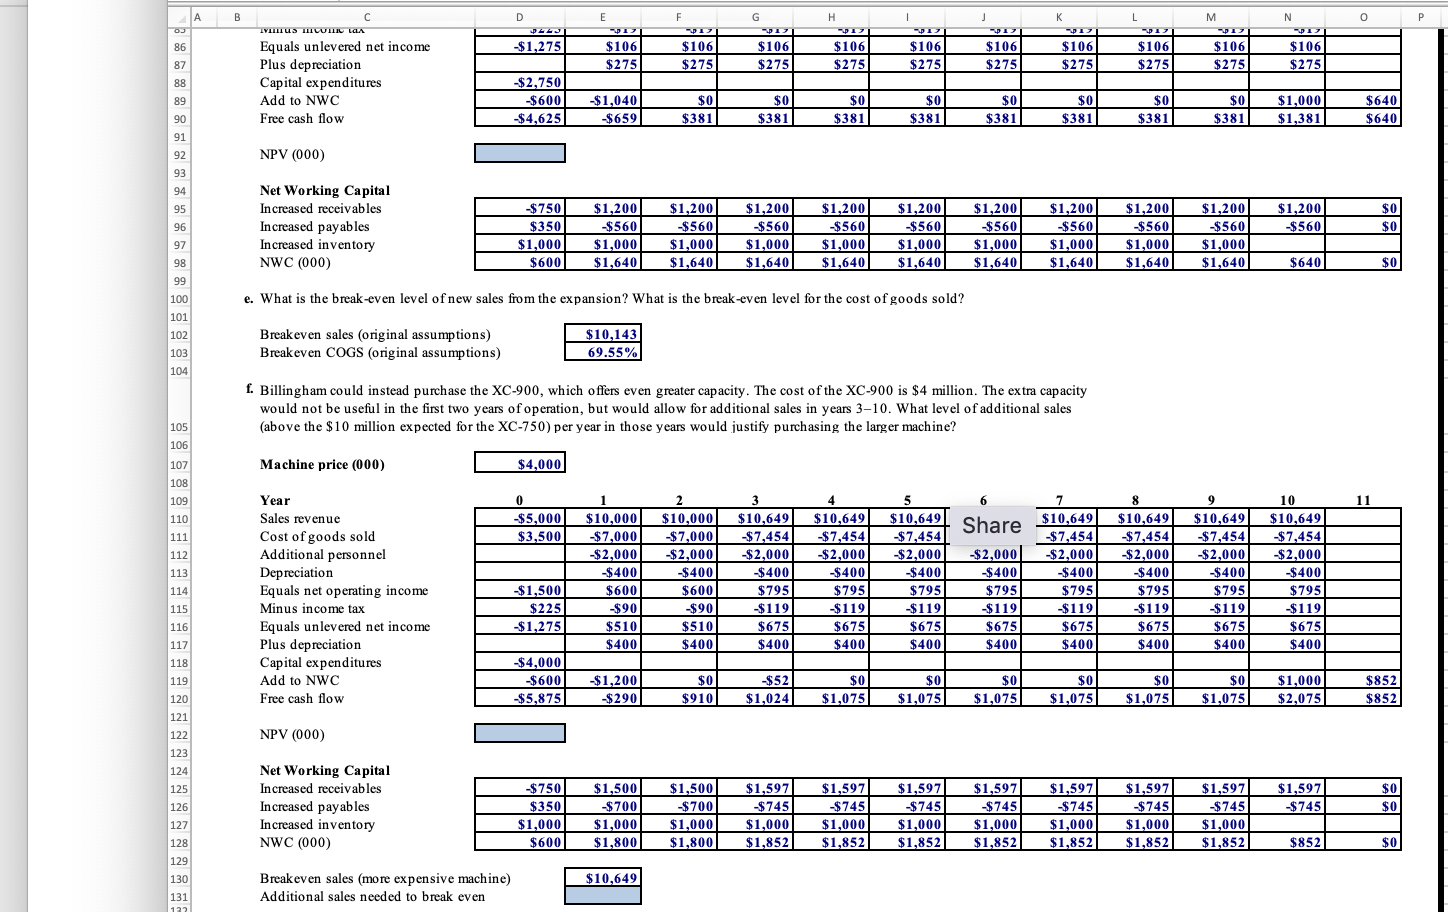
B M N 0 3 Complete the steps below using cell references to given data or previous calculations. In some cases, a simple cell reference is all you need. To copy/paste a formula across a row or down a column, an absolute cell reference or a mixed cell reference may be preferred. If a specific Excel function is to be used, the directions will specify the use of that function. Do not type in numerical data into a cell or function. Instead, make a reference to the cell in which the data is found. Make your computations only in the blue cells highlighted below. In all cases, unless otherwise directed, use the earliest appearance of the data in your formulas, usually the Given Data section. Billingham Packaging is considering expanding its production capacity by purchasing a new machine, the XC-750. The cost of the XC-750 is $2.75 million. Unfortunately, installing this machine will take several months and will partially disrupt production. The firm has just completed a $50,000 feasibility study to analyze the decision to buy the XC-750, resulting in the following estimates: Marketing: Once the XC-750 is operating next year, the extra capacity is expected to generate $10 million per year in additional sales, which will continue for the 10-year life of the machine. Operations. The disruption caused by the installation will decrease sales by $5 million this year. Once the machine is operating next year, the cost of goods for the products produced by the XC-750 is expected to be 70% of their sale price. The increased production will require additional inventory on hand of $1 million to be added in year 0 and depleted in year 10. . Human Resources: The expansion will require additional sales and administrative personnel at a cost of $2 million per year. Accounting: The XC-750 will be depreciated via the straight-line method over the 10-year life of the machine. The fim expects receivables from the new sales to be 15% of revenues and payables to be 10% of the cost of goods sold (starting in year 0 and ending in year 10). Billingham's marginal corporate tax rate is 15% a. Determine the incremental camings from the purchase of the XC-750. b. Determine the free cash flow from the purchase of the XC-750. c. If the appropriate cost of capital for the expansion is 10%, compute the NPV of the purchase. d. While the expected new sales will be $10 million per year from the expansion, estimates range from $8 million to $12 million. What is the NPV in the worst case? In the best case? e. What is the break-even level of new sales from the expansion? What is the break-even level for the cost of goods sold? f. Billingham could instead purchase the XC-900, which offers even greater capacity. The cost of the XC-900 is $4 million. The extra capacity would not be useful in the first two years of operation, but would allow for additional sales in years 3-10. What level of additional sales (above the $10 million expected for the XC-750) per year in those years would justify purchasing the larger machine? 8 9 10 11 12 13 14 15 16 17 18 Tax rate Cost of goods as % of sales Receivables as % of sales Payables as % of COGS Machine price (000) Machine life (years) Increased inventory (000) First year sales (000) Disrupted sales (000) Personnel (000) Cost of capital 15% 70% 15% 10% $2.750 10 $1.000 $10,000 $5.000 $2.000 10% 19 20 21 22 23 24 25 26 27 28 29 30 31 32 33 34 35 36 37 38 39 a. Determine the incremental camings from the purchase of the XC-750 b. Determine the free cash flow from the purchase of the XC-750 c c. If the appropriate cost of capital for the expansion is 10%, compute the NPV of the purchase. 11 0 $5,000 $3,500 Year Sales revenue Cost of goods sold Additional personnel Depreciation Equals net operating income Minus income tax Equals unlevered net income Plus depreciation Capital expenditures Add to NWC Free cash flow $10,000 $7,000 -$2,000 -$275 $725 $109 $616) $275 2 $10,000 $7,000 $2,000 -$275 $725 $109 $616 $275 3 3 $10,000 -$7,000 $2,000 $275 $725 $109 $616 $275 4 $10,000 $7.000 -$2,000 $275 $725 -$109 - $616 $ $2751 5 $10,000 $7.000 $2,000 $275 $725 -S109 $616 S275 6 6 $10,000 $7,000 $2,000 $275 $725 -$109 $616 $275 7 $10,000 $7,000 $2,000 -$275 $725 -$109 $6161 $275 8 $10,000 $7.000 $2.000 -$275 $725 S109 S616 $275 9 $10,000 $7,000 $2,000 -$275 $725 $109 $616 $275 10 $10,000 $7.000 $2.000 $275 $725 -$109 $616 $275 $1.500 S225 $1.275 40 41 42 43 44 $2.750 S600 $4.625 -$1,200 $309 SO $891 SO 5891 S800 $0 $891 SO S891 SO $891 $0 $891 SO $891 SO $891 $1,000 $1,891 $800 45 NPV (000) ) 46 SO 47 48 49 50 51 Net Working Capital Increased receivables Increased payables Increased inventory NWC (000) SO $750 S350 $1,000 S600 $1,500 $700 $1,000 $1,800 $1,500 $700 $1,500 -$700 $1,000 $1,800 $1,500 $700 $1,000 $1,800 $1,500 $7001 $1,000 $1,800 $1.500 -$700 $1,000 $1,800 $1,500 $700 $1,000 $1,800 $1,500 -$700 $1,000 $1,800 $1,500 -S700 $1,000 $1,800 $1,500 $700 $1,000 $1,800 S800 SO 8-25 + D E F G H K L M N 46 47 48 49 50 51 52 Net Working Capital Increased receivables Increased payables Increased inventory NWC (000) $750 $350 $1,000 $600 $1,500 $700 $1,000 $1,800 $0 $0 $1,500 $700 $1,000 $1,800 $1,500 $700 $1,000 $1,800 $1,500 -$700 $1.500 $700 $1,000 $1.800 $1,500 $700 $1,000 $1.800 $1,500 $700 $1,000 $1,800 $1,500 $700 $1,000 $1,800 $1,500 $700 $1,000 $1,500 $700 $1,000 $1.800 $1,800 $800 $0 11 d. While the expected new sales will be $10 million per year from the expansion, estimates range from $8 million to $12 million. What is the NPV in the worst case? In the best case? ? High revenue $12.000 Low revenue $8,000 Free Cash Flows in the Best Case Year 0 1 2 3 4 5 6 7 Sales revenue -$5,000 $12.000 $12.000 S12.000 $12,000 S12,000 $12.000 $12,000 Cost of goods sold $3.500 $8.400 $8.400 $8.400 $8.400 $8.400 $8.400 $8.400 Additional personnel $2,000 -$2,000 -$2,000 -$2,000 -$2,000 $2,000 $2,000 Depreciation $275 $275 -$275 $275 $275 $275 5275 Equals net operating income $1,500 $1,325 $1,325 $1,325 $1,325 $1,325 $1,325 $1.325 Minus income tax $225 $199 $199 $199 5199 5199 5199 $199 Equals unlevered net income $1,275 $1,126 $1,126 $1.126 $1.126 $1,126 $1.126 $1,126 Plus depreciation $275 $275 $275 $2751 $2751 $275 $275 Capital expenditures -$2,750 Add to NWC $600 $1,360 SI SO SO SO so so Free cash flow $4,625 $41 $1,401 $1,401 $1,401 $1.401 $1.401 $1,401 NPV (000) ( $12,000 $8.400 $2,000 $275 $1,325 $199 $1.126 $275 9 $12,000 $8.400 $2.000 -$275 $1.325 -$199 $1,126 $275 10 $12.000 $8.400 $2,000 -$275 $1,325 -$199 $1,126 $2751 SO $1,401 sol $1,401 $1,000 $2,401 $960 $960 Net Working Capital Increased receivables Increased payables Increased inventory NWC (000) ( $ $1,800 -5840 $0 $0 $750 S350 $1,000 $600 $1,800 $840 $1,000 $1,960 $1,800 5840 $1,000 $1,960 $1,800 -5840 $1,000 $1,960 $1.800 -5840 $1,000 $1,960 $1.800 -5840 $1,000 $1,960 $960 so 53 54 55 56 57 58 59 60 61 62 63 64 65 66 67 68 69 70 71 72 73 74 75 76 77 78 79 80 81 82 83 84 85 86 87 88 89 90 91 92 93 94 95 96 97 98 99 100 101 102 103 104 0 9 11 $5,000 $3.500 Year Sales revenue Cost of goods sold Additional personnel Depreciation Equals net operating income Minus income tax Equals unlevered net income Plus depreciation Capital expenditures Add to NWC Free cash flow 1 $8,000 $5.600 -$2,000 $275 $125 $19 $106 $275 2 $8,000 $5.600 -$2,000 $275 S125 -$19 S106 $275 3 $8,000 $5,600 -$2,000 $275 S125 $19 S106 $275 $1,800 $1.800 $1.800 $1.800 -S8401 -S840 -S840 -S840 $1.000 $1.000 $1.000 $1.000 $1,960 $1,960 $1,960 $1,9601 Free Cash Flows in the Worst Case 4 5 5 6 7 7 $8,000 $8,000 $8,000 $8,000 $5.600 $5.600 $5.600 $5.600 -$2,000 -$2,000 $2.000 -$2,000 $275 $275 $275 $275 S125 $123 S125 S125 $19 $19 $19 $19 $ S106) S106 S106 $106 $275 $ $275 $275 5275 8 $8,000 $5,600 -$2,000 $275 S125 $19 $106 $275 $8,000 $5,600 -$2,000 -$275 S12S $19 $106 $275 10 $8,000 $5,600 -$2,000 $275 $125 $19 $106 $275 $1,500 $225 $1,275 -$2.750 $600 $4,625 -$1,040 $659 SO $381 SO $381 SO $3811 SO $381 SO $381 SO $381 $0 $381 $0 $ $381 $1,000 $ $1.381 $640 $640 NPV (000) Net Working Capital Increased receivables Increased payables Increased inventory NWC (000) $750 $350 $1,000 S600 $0 $0 $1,200 S560 $1,000 $1,640 $1,200 S560 $1,000 $1,640 $1,200 S560 $1.000 $1,640 $1,200 S5601 $1.000 $1,640 $1,200 -S560 $1,000 $1,640 $1,200 S560 $1.000 $ $1,640 $1,200 $560 $1,200 -S560 $1,000 $1,640 $1.200 -S560 $1.000 $1,640 $1,200 -5560 $1,000 $1,640 $640 $0 e. What is the break-even level of new sales from the expansion? What is the break-even level for the cost of goods sold? -? $10.143 Breakeven sales (original assumptions) Breakeven COGS (original assumptions) 69.55% - Billingham could instead purchase the XC-900, which offers even greater capacity. The cost of the XC-900 is $4 million. The extra capacity would not be useful in the first two years of operation, but would allow for additional sales in years 3-10. What level of additional sales (above the $10 million expected for the XC-750) per year in those years would justify purchasing the larger machine? 105 106 107 108 109 Machine price (000) ) $4,000 Year 10 11 8-25 + Enter B B E 1 O P | A o 86 D PLEJ I $1,275 F 21 I $106 $275 $106 G I $106 $2751 C TYTUS MILUTII LALA Equals unlevered net income Plus depreciation Capital expenditures Add to NWC Free cash flow H PI $106 $275 M PI $106 N PI $106 PI $106 $275 K I $106 $275 $106 $275 L L -PI $106 $275 87 $275 $275 $275 88 89 $2,750 $600 $4,625 -$1.040 $659 $0 $381 $0 $381 $0 $381 $0 $381 $0 0 $381 $0 $381 $0 $381 $0 $381 $1,000 $1,381 $640 $640 90 91 92 NPV (000) 93 94 95 Net Working Capital Increased receivables Increased payables Increased inventory NWC (000) $1,200 $560 $0 $0 96 97 $750 $350 $1,000 $600 $1,200 $560 $1,000 $1,640 $1,200 $560 $1,000 $1,640 $1,200 $560 $1,000 $1,640 $1,200 $560 $1,000 $1,640 $1,200 $560 $1,000 $1,640 $1,200 -$560 $1,000 $1,640 $1,200 $560 $1,000 $1,640 $1,200 $560 $1,000 $1,640 $1,200 $560 $1,000 $1,640 $640 $0 98 99 100 e. What is the break-even level of new sales from the expansion? What is the break-even level for the cost of goods sold? 101 102 103 104 Breakeven sales (original assumptions) Breakeven COGS (original assumptions) $10,143 69.55% f. Billingham could instead purchase the XC-900, which offers even greater capacity. The cost of the XC-900 is $4 million. The extra capacity would not be useful in the first two years of operation, but would allow for additional sales in years 3-10. What level of additional sales (above the $10 million expected for the XC-750) per year in those years would justify purchasing the larger machine? Machine price (000) $4,000 8 11 0 $5,000 $3,500 Share $10,649 105 106 107 108 109 110 111 112 113 114 115 116 117 118 119 120 121 122 123 124 125 126 Year Sales revenue Cost of goods sold Additional personnel Depreciation Equals net operating income Minus income tax Equals unlevered net income Plus depreciation Capital expenditures Add to NWC Free cash flow 1 $10,000 $7,000 $2,000 $400 $600 $90 $510 $400 2 $10,000 $7,000 $2,000 $400 $600 $90 $510 $400 3 $10,649 $7,454 $2,000 $400 $795 $119 $675 $400 4 $10,649 $7,454 $2,000 $400 $795 -$119 $675 $400 5 $10,649 $7,454 $2,000 $400 $795 $119 $675 $400 $2,000 $400 $795 $119 $675 $400 7 $ $ 7,454 $2,000 $400 $795 $119 $675 $400 $10,649 -$7.454 $2,000 $400 $795 $119 $675 $400 9 $10,649 $ 7,454 $2,000 $400 $795 $119 $675 $400 10 $10,649 $7,454 $2,000 $400 $795 $119 $675 $400 $1,500 $225 $1,275 $4,000 $600 $5,875 $1,200 $290 $0 $910 $52 $1,024 $0 $1,0751 $0 $1,0751 $0 $1,075 $0 $1,075 $0 $1,075 $0 $1,075 $1,000 $2,0751 $852 $852 NPV (000) Net Working Capital Increased receivables Increased payables Increased inventory NWC (000) $1,597 $745 $0 $0 $750 $350 $1,000 $600 $1,500 $700 $1,000 $1,800 $1,500 $700 $1,000 $1,800 $1,597 $745 $1,000 $1,852 $1,597 $745 $1,000 $1,852 $1,597 $745 $1,000 $1,852 $1,597 $745 $1,000 $1,852 $1,597 $745 $1,000 $1,852 $1,597 $745 $1,000 $1,852 $1,597 $745 $1,000 $1,8521 $852 $0 127 128 129 130 131 122 $10,649 Breakeven sales (more expensive machine) Additional sales needed to break even B M N 0 3 Complete the steps below using cell references to given data or previous calculations. In some cases, a simple cell reference is all you need. To copy/paste a formula across a row or down a column, an absolute cell reference or a mixed cell reference may be preferred. If a specific Excel function is to be used, the directions will specify the use of that function. Do not type in numerical data into a cell or function. Instead, make a reference to the cell in which the data is found. Make your computations only in the blue cells highlighted below. In all cases, unless otherwise directed, use the earliest appearance of the data in your formulas, usually the Given Data section. Billingham Packaging is considering expanding its production capacity by purchasing a new machine, the XC-750. The cost of the XC-750 is $2.75 million. Unfortunately, installing this machine will take several months and will partially disrupt production. The firm has just completed a $50,000 feasibility study to analyze the decision to buy the XC-750, resulting in the following estimates: Marketing: Once the XC-750 is operating next year, the extra capacity is expected to generate $10 million per year in additional sales, which will continue for the 10-year life of the machine. Operations. The disruption caused by the installation will decrease sales by $5 million this year. Once the machine is operating next year, the cost of goods for the products produced by the XC-750 is expected to be 70% of their sale price. The increased production will require additional inventory on hand of $1 million to be added in year 0 and depleted in year 10. . Human Resources: The expansion will require additional sales and administrative personnel at a cost of $2 million per year. Accounting: The XC-750 will be depreciated via the straight-line method over the 10-year life of the machine. The fim expects receivables from the new sales to be 15% of revenues and payables to be 10% of the cost of goods sold (starting in year 0 and ending in year 10). Billingham's marginal corporate tax rate is 15% a. Determine the incremental camings from the purchase of the XC-750. b. Determine the free cash flow from the purchase of the XC-750. c. If the appropriate cost of capital for the expansion is 10%, compute the NPV of the purchase. d. While the expected new sales will be $10 million per year from the expansion, estimates range from $8 million to $12 million. What is the NPV in the worst case? In the best case? e. What is the break-even level of new sales from the expansion? What is the break-even level for the cost of goods sold? f. Billingham could instead purchase the XC-900, which offers even greater capacity. The cost of the XC-900 is $4 million. The extra capacity would not be useful in the first two years of operation, but would allow for additional sales in years 3-10. What level of additional sales (above the $10 million expected for the XC-750) per year in those years would justify purchasing the larger machine? 8 9 10 11 12 13 14 15 16 17 18 Tax rate Cost of goods as % of sales Receivables as % of sales Payables as % of COGS Machine price (000) Machine life (years) Increased inventory (000) First year sales (000) Disrupted sales (000) Personnel (000) Cost of capital 15% 70% 15% 10% $2.750 10 $1.000 $10,000 $5.000 $2.000 10% 19 20 21 22 23 24 25 26 27 28 29 30 31 32 33 34 35 36 37 38 39 a. Determine the incremental camings from the purchase of the XC-750 b. Determine the free cash flow from the purchase of the XC-750 c c. If the appropriate cost of capital for the expansion is 10%, compute the NPV of the purchase. 11 0 $5,000 $3,500 Year Sales revenue Cost of goods sold Additional personnel Depreciation Equals net operating income Minus income tax Equals unlevered net income Plus depreciation Capital expenditures Add to NWC Free cash flow $10,000 $7,000 -$2,000 -$275 $725 $109 $616) $275 2 $10,000 $7,000 $2,000 -$275 $725 $109 $616 $275 3 3 $10,000 -$7,000 $2,000 $275 $725 $109 $616 $275 4 $10,000 $7.000 -$2,000 $275 $725 -$109 - $616 $ $2751 5 $10,000 $7.000 $2,000 $275 $725 -S109 $616 S275 6 6 $10,000 $7,000 $2,000 $275 $725 -$109 $616 $275 7 $10,000 $7,000 $2,000 -$275 $725 -$109 $6161 $275 8 $10,000 $7.000 $2.000 -$275 $725 S109 S616 $275 9 $10,000 $7,000 $2,000 -$275 $725 $109 $616 $275 10 $10,000 $7.000 $2.000 $275 $725 -$109 $616 $275 $1.500 S225 $1.275 40 41 42 43 44 $2.750 S600 $4.625 -$1,200 $309 SO $891 SO 5891 S800 $0 $891 SO S891 SO $891 $0 $891 SO $891 SO $891 $1,000 $1,891 $800 45 NPV (000) ) 46 SO 47 48 49 50 51 Net Working Capital Increased receivables Increased payables Increased inventory NWC (000) SO $750 S350 $1,000 S600 $1,500 $700 $1,000 $1,800 $1,500 $700 $1,500 -$700 $1,000 $1,800 $1,500 $700 $1,000 $1,800 $1,500 $7001 $1,000 $1,800 $1.500 -$700 $1,000 $1,800 $1,500 $700 $1,000 $1,800 $1,500 -$700 $1,000 $1,800 $1,500 -S700 $1,000 $1,800 $1,500 $700 $1,000 $1,800 S800 SO 8-25 + D E F G H K L M N 46 47 48 49 50 51 52 Net Working Capital Increased receivables Increased payables Increased inventory NWC (000) $750 $350 $1,000 $600 $1,500 $700 $1,000 $1,800 $0 $0 $1,500 $700 $1,000 $1,800 $1,500 $700 $1,000 $1,800 $1,500 -$700 $1.500 $700 $1,000 $1.800 $1,500 $700 $1,000 $1.800 $1,500 $700 $1,000 $1,800 $1,500 $700 $1,000 $1,800 $1,500 $700 $1,000 $1,500 $700 $1,000 $1.800 $1,800 $800 $0 11 d. While the expected new sales will be $10 million per year from the expansion, estimates range from $8 million to $12 million. What is the NPV in the worst case? In the best case? ? High revenue $12.000 Low revenue $8,000 Free Cash Flows in the Best Case Year 0 1 2 3 4 5 6 7 Sales revenue -$5,000 $12.000 $12.000 S12.000 $12,000 S12,000 $12.000 $12,000 Cost of goods sold $3.500 $8.400 $8.400 $8.400 $8.400 $8.400 $8.400 $8.400 Additional personnel $2,000 -$2,000 -$2,000 -$2,000 -$2,000 $2,000 $2,000 Depreciation $275 $275 -$275 $275 $275 $275 5275 Equals net operating income $1,500 $1,325 $1,325 $1,325 $1,325 $1,325 $1,325 $1.325 Minus income tax $225 $199 $199 $199 5199 5199 5199 $199 Equals unlevered net income $1,275 $1,126 $1,126 $1.126 $1.126 $1,126 $1.126 $1,126 Plus depreciation $275 $275 $275 $2751 $2751 $275 $275 Capital expenditures -$2,750 Add to NWC $600 $1,360 SI SO SO SO so so Free cash flow $4,625 $41 $1,401 $1,401 $1,401 $1.401 $1.401 $1,401 NPV (000) ( $12,000 $8.400 $2,000 $275 $1,325 $199 $1.126 $275 9 $12,000 $8.400 $2.000 -$275 $1.325 -$199 $1,126 $275 10 $12.000 $8.400 $2,000 -$275 $1,325 -$199 $1,126 $2751 SO $1,401 sol $1,401 $1,000 $2,401 $960 $960 Net Working Capital Increased receivables Increased payables Increased inventory NWC (000) ( $ $1,800 -5840 $0 $0 $750 S350 $1,000 $600 $1,800 $840 $1,000 $1,960 $1,800 5840 $1,000 $1,960 $1,800 -5840 $1,000 $1,960 $1.800 -5840 $1,000 $1,960 $1.800 -5840 $1,000 $1,960 $960 so 53 54 55 56 57 58 59 60 61 62 63 64 65 66 67 68 69 70 71 72 73 74 75 76 77 78 79 80 81 82 83 84 85 86 87 88 89 90 91 92 93 94 95 96 97 98 99 100 101 102 103 104 0 9 11 $5,000 $3.500 Year Sales revenue Cost of goods sold Additional personnel Depreciation Equals net operating income Minus income tax Equals unlevered net income Plus depreciation Capital expenditures Add to NWC Free cash flow 1 $8,000 $5.600 -$2,000 $275 $125 $19 $106 $275 2 $8,000 $5.600 -$2,000 $275 S125 -$19 S106 $275 3 $8,000 $5,600 -$2,000 $275 S125 $19 S106 $275 $1,800 $1.800 $1.800 $1.800 -S8401 -S840 -S840 -S840 $1.000 $1.000 $1.000 $1.000 $1,960 $1,960 $1,960 $1,9601 Free Cash Flows in the Worst Case 4 5 5 6 7 7 $8,000 $8,000 $8,000 $8,000 $5.600 $5.600 $5.600 $5.600 -$2,000 -$2,000 $2.000 -$2,000 $275 $275 $275 $275 S125 $123 S125 S125 $19 $19 $19 $19 $ S106) S106 S106 $106 $275 $ $275 $275 5275 8 $8,000 $5,600 -$2,000 $275 S125 $19 $106 $275 $8,000 $5,600 -$2,000 -$275 S12S $19 $106 $275 10 $8,000 $5,600 -$2,000 $275 $125 $19 $106 $275 $1,500 $225 $1,275 -$2.750 $600 $4,625 -$1,040 $659 SO $381 SO $381 SO $3811 SO $381 SO $381 SO $381 $0 $381 $0 $ $381 $1,000 $ $1.381 $640 $640 NPV (000) Net Working Capital Increased receivables Increased payables Increased inventory NWC (000) $750 $350 $1,000 S600 $0 $0 $1,200 S560 $1,000 $1,640 $1,200 S560 $1,000 $1,640 $1,200 S560 $1.000 $1,640 $1,200 S5601 $1.000 $1,640 $1,200 -S560 $1,000 $1,640 $1,200 S560 $1.000 $ $1,640 $1,200 $560 $1,200 -S560 $1,000 $1,640 $1.200 -S560 $1.000 $1,640 $1,200 -5560 $1,000 $1,640 $640 $0 e. What is the break-even level of new sales from the expansion? What is the break-even level for the cost of goods sold? -? $10.143 Breakeven sales (original assumptions) Breakeven COGS (original assumptions) 69.55% - Billingham could instead purchase the XC-900, which offers even greater capacity. The cost of the XC-900 is $4 million. The extra capacity would not be useful in the first two years of operation, but would allow for additional sales in years 3-10. What level of additional sales (above the $10 million expected for the XC-750) per year in those years would justify purchasing the larger machine? 105 106 107 108 109 Machine price (000) ) $4,000 Year 10 11 8-25 + Enter B B E 1 O P | A o 86 D PLEJ I $1,275 F 21 I $106 $275 $106 G I $106 $2751 C TYTUS MILUTII LALA Equals unlevered net income Plus depreciation Capital expenditures Add to NWC Free cash flow H PI $106 $275 M PI $106 N PI $106 PI $106 $275 K I $106 $275 $106 $275 L L -PI $106 $275 87 $275 $275 $275 88 89 $2,750 $600 $4,625 -$1.040 $659 $0 $381 $0 $381 $0 $381 $0 $381 $0 0 $381 $0 $381 $0 $381 $0 $381 $1,000 $1,381 $640 $640 90 91 92 NPV (000) 93 94 95 Net Working Capital Increased receivables Increased payables Increased inventory NWC (000) $1,200 $560 $0 $0 96 97 $750 $350 $1,000 $600 $1,200 $560 $1,000 $1,640 $1,200 $560 $1,000 $1,640 $1,200 $560 $1,000 $1,640 $1,200 $560 $1,000 $1,640 $1,200 $560 $1,000 $1,640 $1,200 -$560 $1,000 $1,640 $1,200 $560 $1,000 $1,640 $1,200 $560 $1,000 $1,640 $1,200 $560 $1,000 $1,640 $640 $0 98 99 100 e. What is the break-even level of new sales from the expansion? What is the break-even level for the cost of goods sold? 101 102 103 104 Breakeven sales (original assumptions) Breakeven COGS (original assumptions) $10,143 69.55% f. Billingham could instead purchase the XC-900, which offers even greater capacity. The cost of the XC-900 is $4 million. The extra capacity would not be useful in the first two years of operation, but would allow for additional sales in years 3-10. What level of additional sales (above the $10 million expected for the XC-750) per year in those years would justify purchasing the larger machine? Machine price (000) $4,000 8 11 0 $5,000 $3,500 Share $10,649 105 106 107 108 109 110 111 112 113 114 115 116 117 118 119 120 121 122 123 124 125 126 Year Sales revenue Cost of goods sold Additional personnel Depreciation Equals net operating income Minus income tax Equals unlevered net income Plus depreciation Capital expenditures Add to NWC Free cash flow 1 $10,000 $7,000 $2,000 $400 $600 $90 $510 $400 2 $10,000 $7,000 $2,000 $400 $600 $90 $510 $400 3 $10,649 $7,454 $2,000 $400 $795 $119 $675 $400 4 $10,649 $7,454 $2,000 $400 $795 -$119 $675 $400 5 $10,649 $7,454 $2,000 $400 $795 $119 $675 $400 $2,000 $400 $795 $119 $675 $400 7 $ $ 7,454 $2,000 $400 $795 $119 $675 $400 $10,649 -$7.454 $2,000 $400 $795 $119 $675 $400 9 $10,649 $ 7,454 $2,000 $400 $795 $119 $675 $400 10 $10,649 $7,454 $2,000 $400 $795 $119 $675 $400 $1,500 $225 $1,275 $4,000 $600 $5,875 $1,200 $290 $0 $910 $52 $1,024 $0 $1,0751 $0 $1,0751 $0 $1,075 $0 $1,075 $0 $1,075 $0 $1,075 $1,000 $2,0751 $852 $852 NPV (000) Net Working Capital Increased receivables Increased payables Increased inventory NWC (000) $1,597 $745 $0 $0 $750 $350 $1,000 $600 $1,500 $700 $1,000 $1,800 $1,500 $700 $1,000 $1,800 $1,597 $745 $1,000 $1,852 $1,597 $745 $1,000 $1,852 $1,597 $745 $1,000 $1,852 $1,597 $745 $1,000 $1,852 $1,597 $745 $1,000 $1,852 $1,597 $745 $1,000 $1,852 $1,597 $745 $1,000 $1,8521 $852 $0 127 128 129 130 131 122 $10,649 Breakeven sales (more expensive machine) Additional sales needed to break even
Step by Step Solution
There are 3 Steps involved in it

Get step-by-step solutions from verified subject matter experts