

Question: Just needing help completing this, I have no idea what I am doing Progress Monitoring Data Activity Instructions: Using information from the IRIS Modules RTi
Just needing help completing this, I have no idea what I am doing
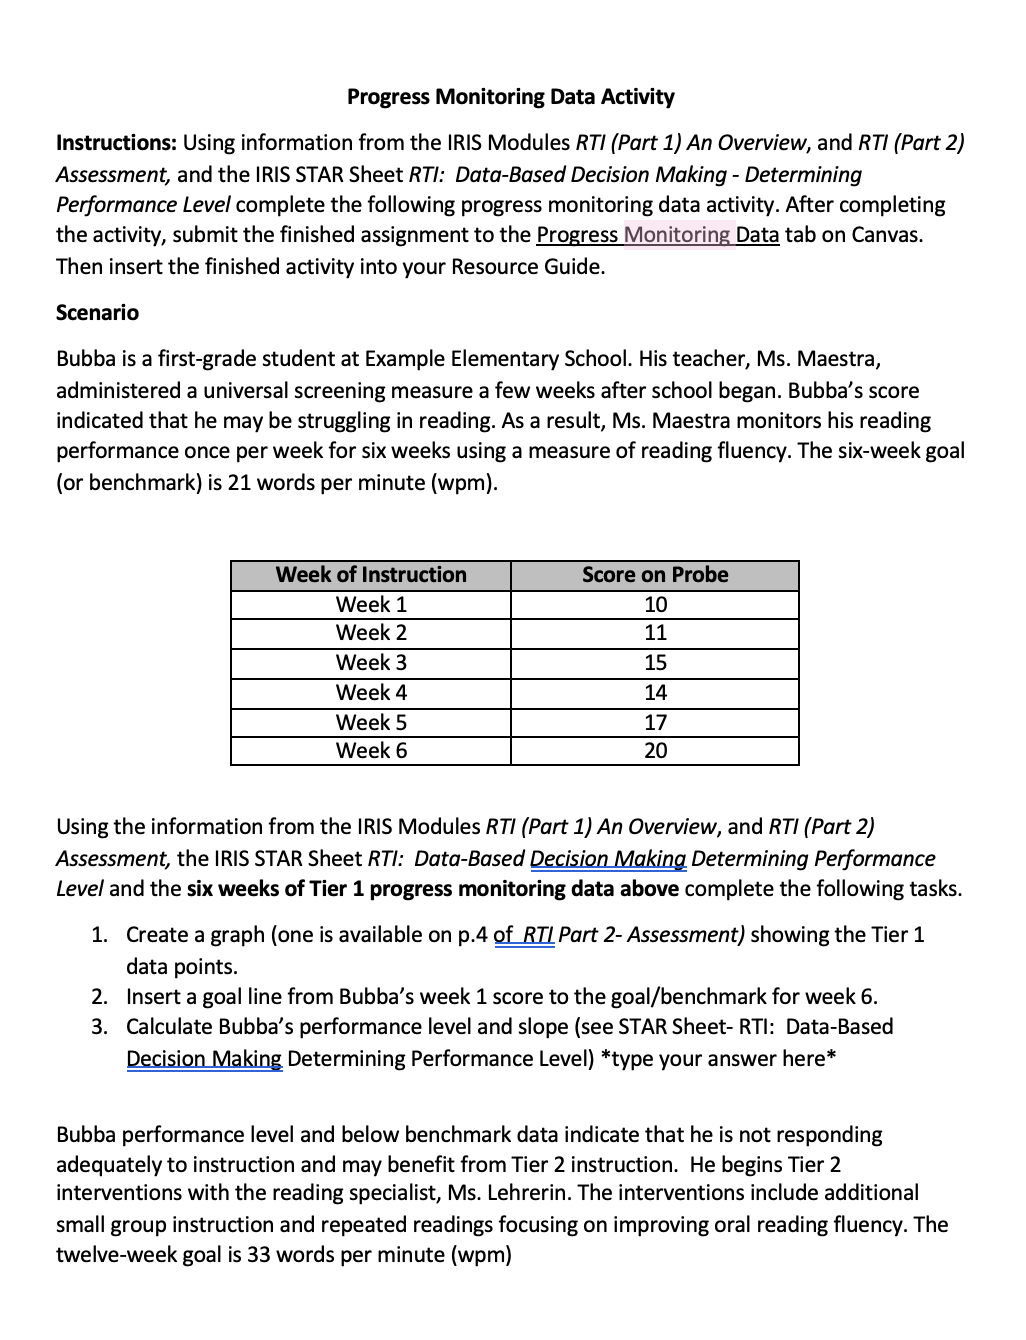
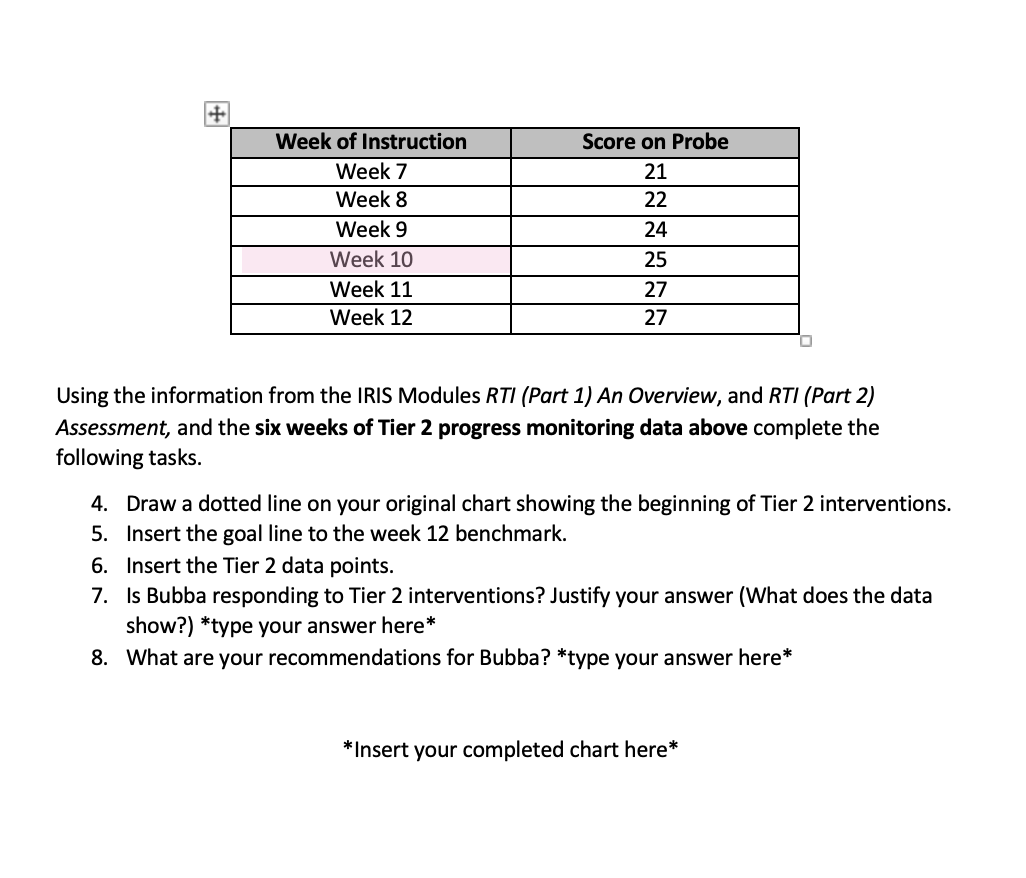
Progress Monitoring Data Activity Instructions: Using information from the IRIS Modules RTi (Part 1) An Overview, and RH (Part 2} Assessment, and the IRIS STAR Sheet RTI: Data-Based Decision Making - Determining Performance Level complete the following progress monitoring data activity. After completing the activity, submit the nished assignment to the Progress Monitoring Data tab on Canvas. Then insert the nished activity into your Resource Guide. Scenario Bubba is a rst-grade student at Example Elementary School. His teacher, Ms. Maestra, administered a universal screening measure a few weeks after school began. Bubba's score indicated that he may be struggling in reading. As a result, Ms. Maestra monitors his reading performance once per week for six weeks using a measure of reading fluency. The six-week goal (or benchmark} is 21 words per minute (wpml. Using the information from the IRIS Modules RTi (Part 1) An Overview, and RT? (Part 2) Assessment, the IRIS STAR Sheet RTI: Data-Based m Determining Performance Levei and the six weeks ofTier 1 progress monitoring data above complete the following tasks. 1. Create a graph (one is available on p.4 Elf Part 2- Assessment) showing the Tier 1 data points. 2. Insert a goal line from Bubba's week 1 score to the goal/benchmark for week 6. 3. Calculate Bubba's performance level and slope (see STAR Sheet RTI: Data-Based m Determining Performance Level} *type your answer here\" Bubba performance level and below benchmark data indicate that he is not responding adequately to instruction and may benefit from Tier 2 instruction. He begins Tier 2 interventions with the reading specialist, Ms. Lehrerin. The interventions include additional small group instruction and repeated readings focusing on improving oral reading fluency. The twelve-week goal is 33 words per minute (wpm) Using the information from the IRIS Modules R'l'lr (Part 1) An Overview, and NH' (Part 2) Assessment, and the six weeks of Tier 2 progress monitoring data above complete the following tasks. 4. Draw a dotted line on your original chart showing the beginning of Tier 2 interventions. 5. Insert the goal line to the week 12 benchmark. 6. Insert the Tier 2 data points. 7 Is Bubba responding to Tier 2 interventions? Justify your answer (What does the data show?) *type your answer here* What are your recommendations for Bubba? *type your answer here\" 9 *Insert your completed chart here\
Step by Step Solution
There are 3 Steps involved in it

Get step-by-step solutions from verified subject matter experts