

Question: Just Part B please. Homework: Chapter 3 ... Question 1, Problem 6 Part 2 of 6 HW Score: 0%, 0 of 3 points O Points:
Just Part B please.
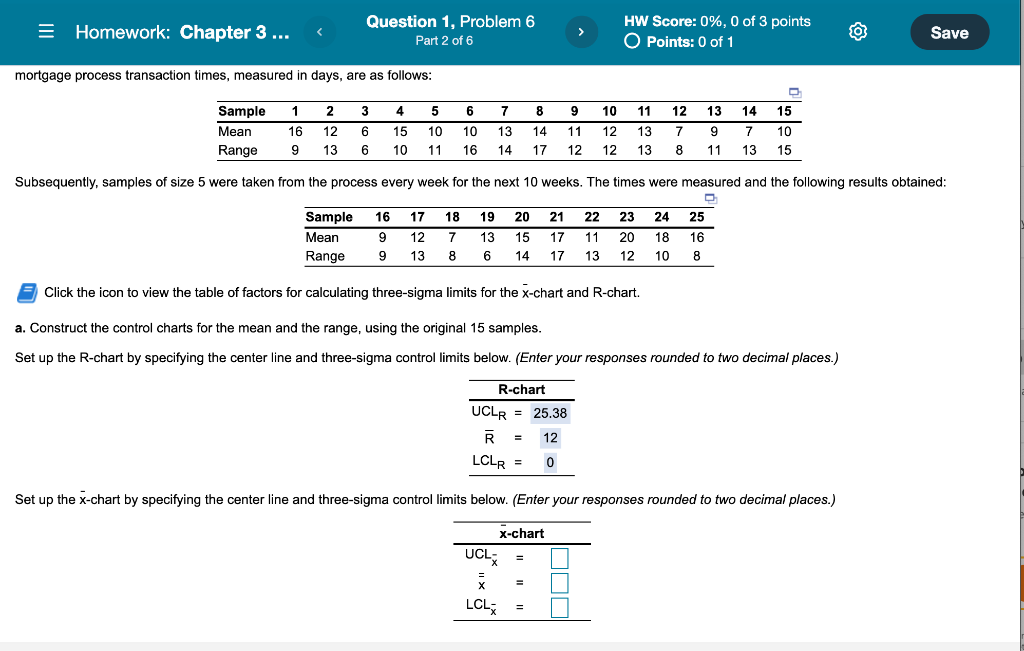
Homework: Chapter 3 ... Question 1, Problem 6 Part 2 of 6 HW Score: 0%, 0 of 3 points O Points: 0 of 1 O Save mortgage process transaction times, measured in days, are as follows: 1 2 3 8 9 10 15 Sample Mean Range 7 13 12 16 9 4 5 6 15 10 10 10 11 16 6 6 14 17 11 12 12 12 11 12 13 7 13 8 13 9 11 14 7 13 10 15 13 14 Subsequently, samples of size 5 were taken from the process every week for the next 10 weeks. The times were measured and the following results obtained: 16 17 18 19 20 25 Sample Mean Range 13 15 9 9 12 13 7 8 21 17 17 22 11 13 23 20 12 24 18 10 16 8 6 14 Click the icon to view the table of factors for calculating three-sigma limits for the x-chart and R-chart. a. Construct the control charts for the mean and the range, using the original 15 samples. Set up the R-chart by specifying the center line and three-sigma control limits below. (Enter your responses rounded to two decimal places.) R-chart UCLR = 25.38 R 12 LCLR = 0 Set up the x-chart by specifying the center line and three-sigma control limits below. (Enter your responses rounded to two decimal places.) X-chart UCL = = = LCLStep by Step Solution
There are 3 Steps involved in it
1 Expert Approved Answer
Step: 1 Unlock

Question Has Been Solved by an Expert!
Get step-by-step solutions from verified subject matter experts
Step: 2 Unlock
Step: 3 Unlock