

Question: Just question 13 goods are subs at 600 units. Problems and Exercises 9. CALCULATING PRICE ELASTICITY OF DEMAND Suppose that 50 units of a good
Just question 13
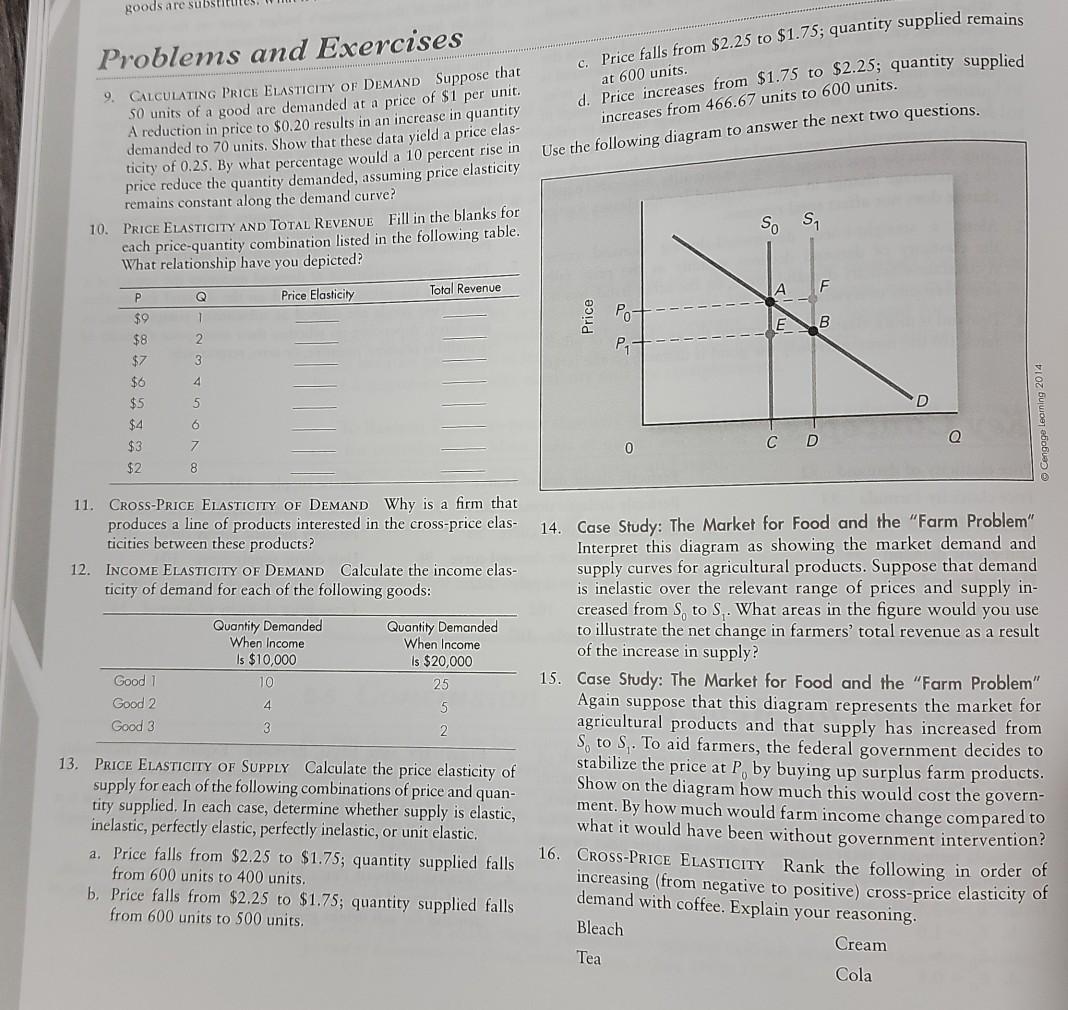
goods are subs at 600 units. Problems and Exercises 9. CALCULATING PRICE ELASTICITY OF DEMAND Suppose that 50 units of a good are demanded at a price of $1 per unit. A reduction in price to $0.20 results in an increase in quantity demanded to 70 units. Show that these data yield a price elas- ticity of 0.25. By what percentage would a 10 percent rise in price reduce the quantity demanded, assuming price elasticity remains constant along the demand curve? 10. PRICE ELASTICITY AND TOTAL REVENUE Fill in the blanks for cach price-quantity combination listed in the following table. What relationship have you depicted? c. Price falls from $2.25 to $1.75; quantity supplied remains d. Price increases from $1.75 to $2.25; quantity supplied increases from 466.67 units to 600 units. Use the following diagram to answer the next two questions. F Total Revenue Q Price Elasticity $9 7 B 2 3 P4 4 $8 $7 $6 $5 $4 $3 $2 5 D Cengage learning 2014 6 D C Q 7 0 8 11. CROSS-PRICE ELASTICITY OF DEMAND Why is a firm that produces a line of products interested in the cross-price elas- ticities between these products? 12. INCOME ELASTICITY OF DEMAND Calculate the income elas- ticity of demand for each of the following goods: Quantity Demanded When Income Is $10,000 10 Quantity Demanded When Income Is $20,000 25 5 Good 1 Good 2 Good 3 4 3 2. 14. Case Study: The Market for Food and the "Farm Problem" Interpret this diagram as showing the market demand and supply curves for agricultural products. Suppose that demand is inelastic over the relevant range of prices and supply in- creased from S, to S. What areas in the figure would you use to illustrate the net change in farmers' total revenue as a result of the increase in supply? 15. Case Study: The Market for Food and the "Farm Problem" Again suppose that this diagram represents the market for agricultural products and that supply has increased from S to S. To aid farmers, the federal government decides to stabilize the price at P, by buying up surplus farm products. Show on the diagram how much this would cost the govern- ment. By how much would farm income change compared to what it would have been without government intervention? 16. Cross-Price ELASTICITY Rank the following in order of increasing (from negative to positive) cross-price elasticity of Bleach Cream Tea Cola 13. PRICE ELASTICITY OF SUPPLY Calculate the price elasticity of supply for each of the following combinations of price and quan- tity supplied. In each case, determine whether supply is elastic, inelastic, perfectly elastic, perfectly inelastic, or unit elastic, Price falls from $2.25 to $1.75; quantity supplied falls from 600 units to 400 units. b. Price falls from $2.25 to $1.75; quantity supplied falls from 600 units to 500 units. a demand with coffee. Explain your reasoning
Step by Step Solution
There are 3 Steps involved in it

Get step-by-step solutions from verified subject matter experts