Question: Just steps 3, 4 and 6 Section: In-class exercise #9: PERT Analysis Name: Complete PERT steps 3, 4 and 6 for the following project (should

Just steps 3, 4 and 6Just steps 3, 4 and 6 Section: In-class exercise

Section: In-class exercise #9: PERT Analysis Name: Complete PERT steps 3, 4 and 6 for the following project (should you have time, you're welcome to complete step 2 as well just copy the table below into Excel, excluding the Mean and 'Variance'). To save time, the spreadsheet below can be found in Canvas. Task Duration Predecessors Optimistic Most likely Pessimistic Mean Variance A 20 days None 15 20 23 19.7 1.8 B 40 A 30 40 45 39.2 6.3 40 B 33 40 45 39.7 4.0 D 46 70 59.3 16.0 E 80 A 65 80 90 79.2 17.4 F 20 E 15 20 25 20.0 2.8 G F 17 20 22 19.8 0.7 H 20 16 20 22 19.7 1.0 I 60 G H 52 60 65 59.5 4.7 J 20 D, G, I 15 20 25 20.0 2.8 K 20 J 15 20 19.7 1.8 0 A 60 60 TU 20 23 Step 1: Capture optimistic, pessimistic and most likely task duration estimates Step 2: Calculate mean & variance of each task duration Step 3: Schedule the project using mean durations (ES, EF, LS, LF) Step 4: Calculate mean & standard deviation of critical path Step 5: Plot cumulative normal distribution Step 6: Understand uncertainty (how many project days are connected to finish probabilities of 50%, 70%, 90%, 95%, and 99%) Step 7: Planning project buffers

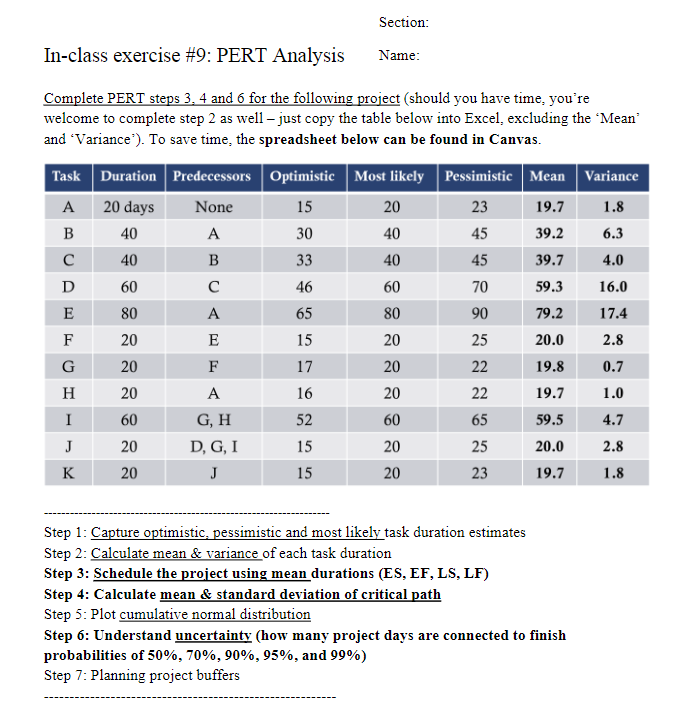
Step by Step Solution

There are 3 Steps involved in it

1 Expert Approved Answer
Step: 1 Unlock blur-text-image
Question Has Been Solved by an Expert!

Get step-by-step solutions from verified subject matter experts

Step: 2 Unlock
Step: 3 Unlock

Students Have Also Explored These Related General Management Questions!