

Question: k a = (E/V)*k e + (B/V)*k d *(1 t) V = E + B k a is the required rate of return on the
ka = (E/V)*ke + (B/V)*kd*(1 t)
V = E + B
ka is the required rate of return on the firms assets, which is the same as WACC.
ke is the firms marginal cost of common equity.
kd is the firms marginal cost of debt.
V is the total market value of the corporation. (not explicitly in the textbook)
E is the market value of outstanding common equity.
B is the market value of outstanding notes, debt, bonds, debentures, mortgages, and other interest-bearing securities.
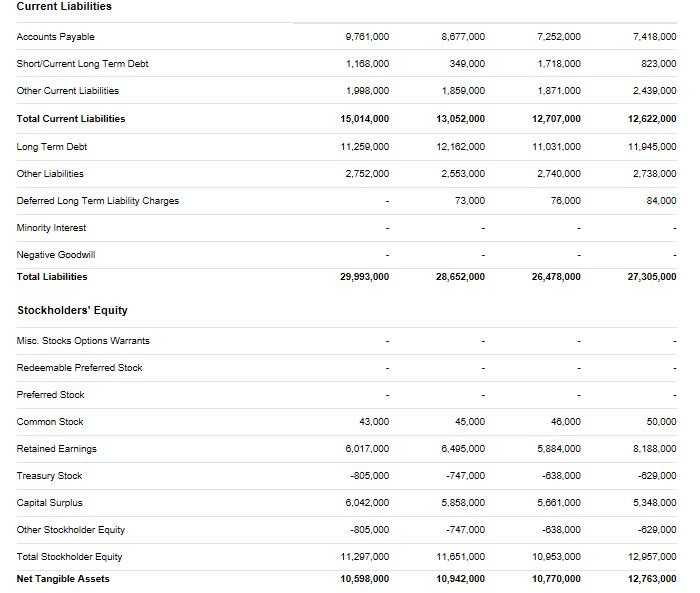
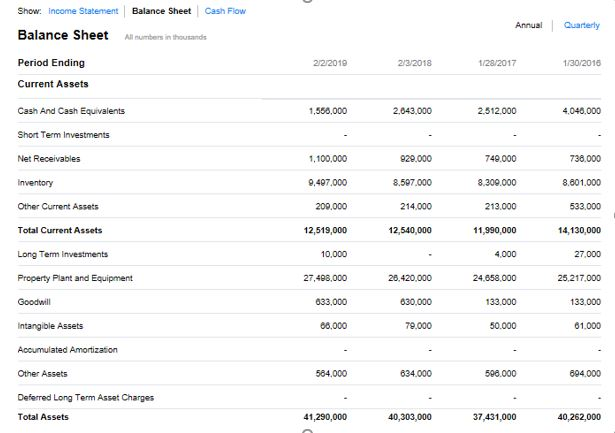
- estimate B by using the (total debt current liabilities) from the most recent balance sheet.
t is the marginal tax rate the firm faces. Given the new tax code, use t = .21
Current Liabilities 7.418,000 823.000 2.439,000 12,622,000 11,945,000 2.738,000 34,000 Accounts Payable Short/Current Long Term Debt Other Current Liabilities 9,781,000 1,168,000 1,998,000 15,014,000 11,259,000 2,752,000 8,677,000 349,000 1,859,000 13,052,000 12,162,000 2,553,000 73,000 7.252,000 1.718,000 1.871.000 12,707,000 11,031,000 2,740,000 78,000 Total Current Liabilities Long Term Debt Other Liabilities Deferred Long Term Liability Charges Minority Interest Negative Goodwill Total Liabilities 29,993,000 28,652,000 26,478,000 27,305,000 Stockholders' Equity Misc. Stocks Options Warrants Redeemable Preferred Stock Preferred Stock Common Stock Retained Earnings Treasury Stock Capital Surplus Other Stockholder Equity Total Stockholder Equity Net Tangible Assets 43,000 6,017,000 -805,000 6,042,000 -805,000 11,297,000 10,598,000 45,000 48,000 5,884,000 -638,000 5,881,000 -638,000 10,953,000 10,770,000 50,000 8,188,000 629,000 6.495,000 747,000 5,858,000 747,000 11,651,000 10,942,000 5,348,000 -629,000 12,957,000 12,763,000 Show: income Statement Balance Sheet Cash Flow Balance Sheet ls in thoutands Period Ending Current Assets Cash And Cash Equivalents Short Term Investments Net Receivables inventory Other Current Assets Total Current Assets Long Term Investments Property Piant and Equipment Goodwill Annusl Quarterly 2/2/2019 2/3/2018 1/28/2017 1130/2016 1,550,000 2.043.000 4040.000 2.512.000 1,100,000 9,497.000 209.000 929.000 8.507.000 214.000 749.000 8.309.000 213.000 736.000 8.801.00 533.000 12,519,000 10,000 27,498,000 633,000 66.000 12,540,000 11,990,000 4,000 24.658,000 133,000 50.000 14,130,000 27,000 25,217,000 133,000 61.000 26.420,000 630.000 9.000 intangible Assets Other Assets Deferred Long Term Asset Charges Total Assets 584,000 634.000 506.000 894.000 37,431,000 41,290,000 40,303,000 40,262,000 Current Liabilities 7.418,000 823.000 2.439,000 12,622,000 11,945,000 2.738,000 34,000 Accounts Payable Short/Current Long Term Debt Other Current Liabilities 9,781,000 1,168,000 1,998,000 15,014,000 11,259,000 2,752,000 8,677,000 349,000 1,859,000 13,052,000 12,162,000 2,553,000 73,000 7.252,000 1.718,000 1.871.000 12,707,000 11,031,000 2,740,000 78,000 Total Current Liabilities Long Term Debt Other Liabilities Deferred Long Term Liability Charges Minority Interest Negative Goodwill Total Liabilities 29,993,000 28,652,000 26,478,000 27,305,000 Stockholders' Equity Misc. Stocks Options Warrants Redeemable Preferred Stock Preferred Stock Common Stock Retained Earnings Treasury Stock Capital Surplus Other Stockholder Equity Total Stockholder Equity Net Tangible Assets 43,000 6,017,000 -805,000 6,042,000 -805,000 11,297,000 10,598,000 45,000 48,000 5,884,000 -638,000 5,881,000 -638,000 10,953,000 10,770,000 50,000 8,188,000 629,000 6.495,000 747,000 5,858,000 747,000 11,651,000 10,942,000 5,348,000 -629,000 12,957,000 12,763,000 Show: income Statement Balance Sheet Cash Flow Balance Sheet ls in thoutands Period Ending Current Assets Cash And Cash Equivalents Short Term Investments Net Receivables inventory Other Current Assets Total Current Assets Long Term Investments Property Piant and Equipment Goodwill Annusl Quarterly 2/2/2019 2/3/2018 1/28/2017 1130/2016 1,550,000 2.043.000 4040.000 2.512.000 1,100,000 9,497.000 209.000 929.000 8.507.000 214.000 749.000 8.309.000 213.000 736.000 8.801.00 533.000 12,519,000 10,000 27,498,000 633,000 66.000 12,540,000 11,990,000 4,000 24.658,000 133,000 50.000 14,130,000 27,000 25,217,000 133,000 61.000 26.420,000 630.000 9.000 intangible Assets Other Assets Deferred Long Term Asset Charges Total Assets 584,000 634.000 506.000 894.000 37,431,000 41,290,000 40,303,000 40,262,000
Step by Step Solution
There are 3 Steps involved in it

Get step-by-step solutions from verified subject matter experts