

Question: K Assume that a randomly selected subject is given a bone density test Bone density test scores are normally distributed with a mean of 0

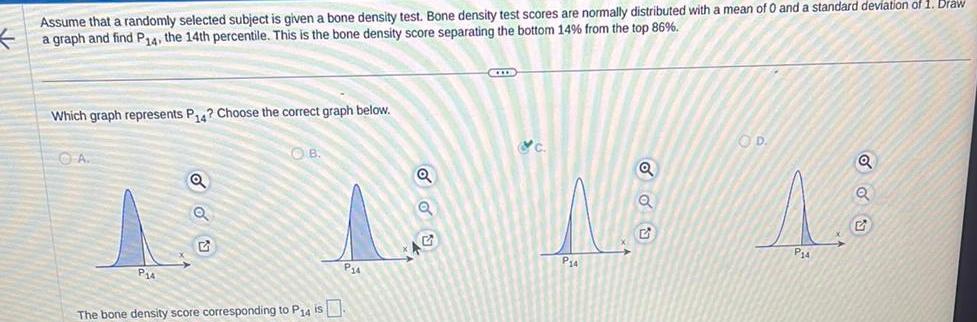
K Assume that a randomly selected subject is given a bone density test Bone density test scores are normally distributed with a mean of 0 and a standard deviation of 1 Draw a graph and find P14 the 14th percentile This is the bone density score separating the bottom 14 from the top 86 Which graph represents P14 Choose the correct graph below A P14 Q Q OB The bone density score corresponding to P14 is P 4 Q c P14 Q OD P14 Q Q
Step by Step Solution
There are 3 Steps involved in it
1 Expert Approved Answer
Step: 1 Unlock

Question Has Been Solved by an Expert!
Get step-by-step solutions from verified subject matter experts
Step: 2 Unlock
Step: 3 Unlock