

Question: k: Chapters 6 and S 6 Question 2 , Problem 6 s . 1 1 ac HW Score: 6 1 . 5 5 % ,
k: Chapters and
Question Problem sac
HW Score: of points
Part of
Points: of
Save
Refer to Table S Factors for Computing Control Chart Limits sigma for this problem.
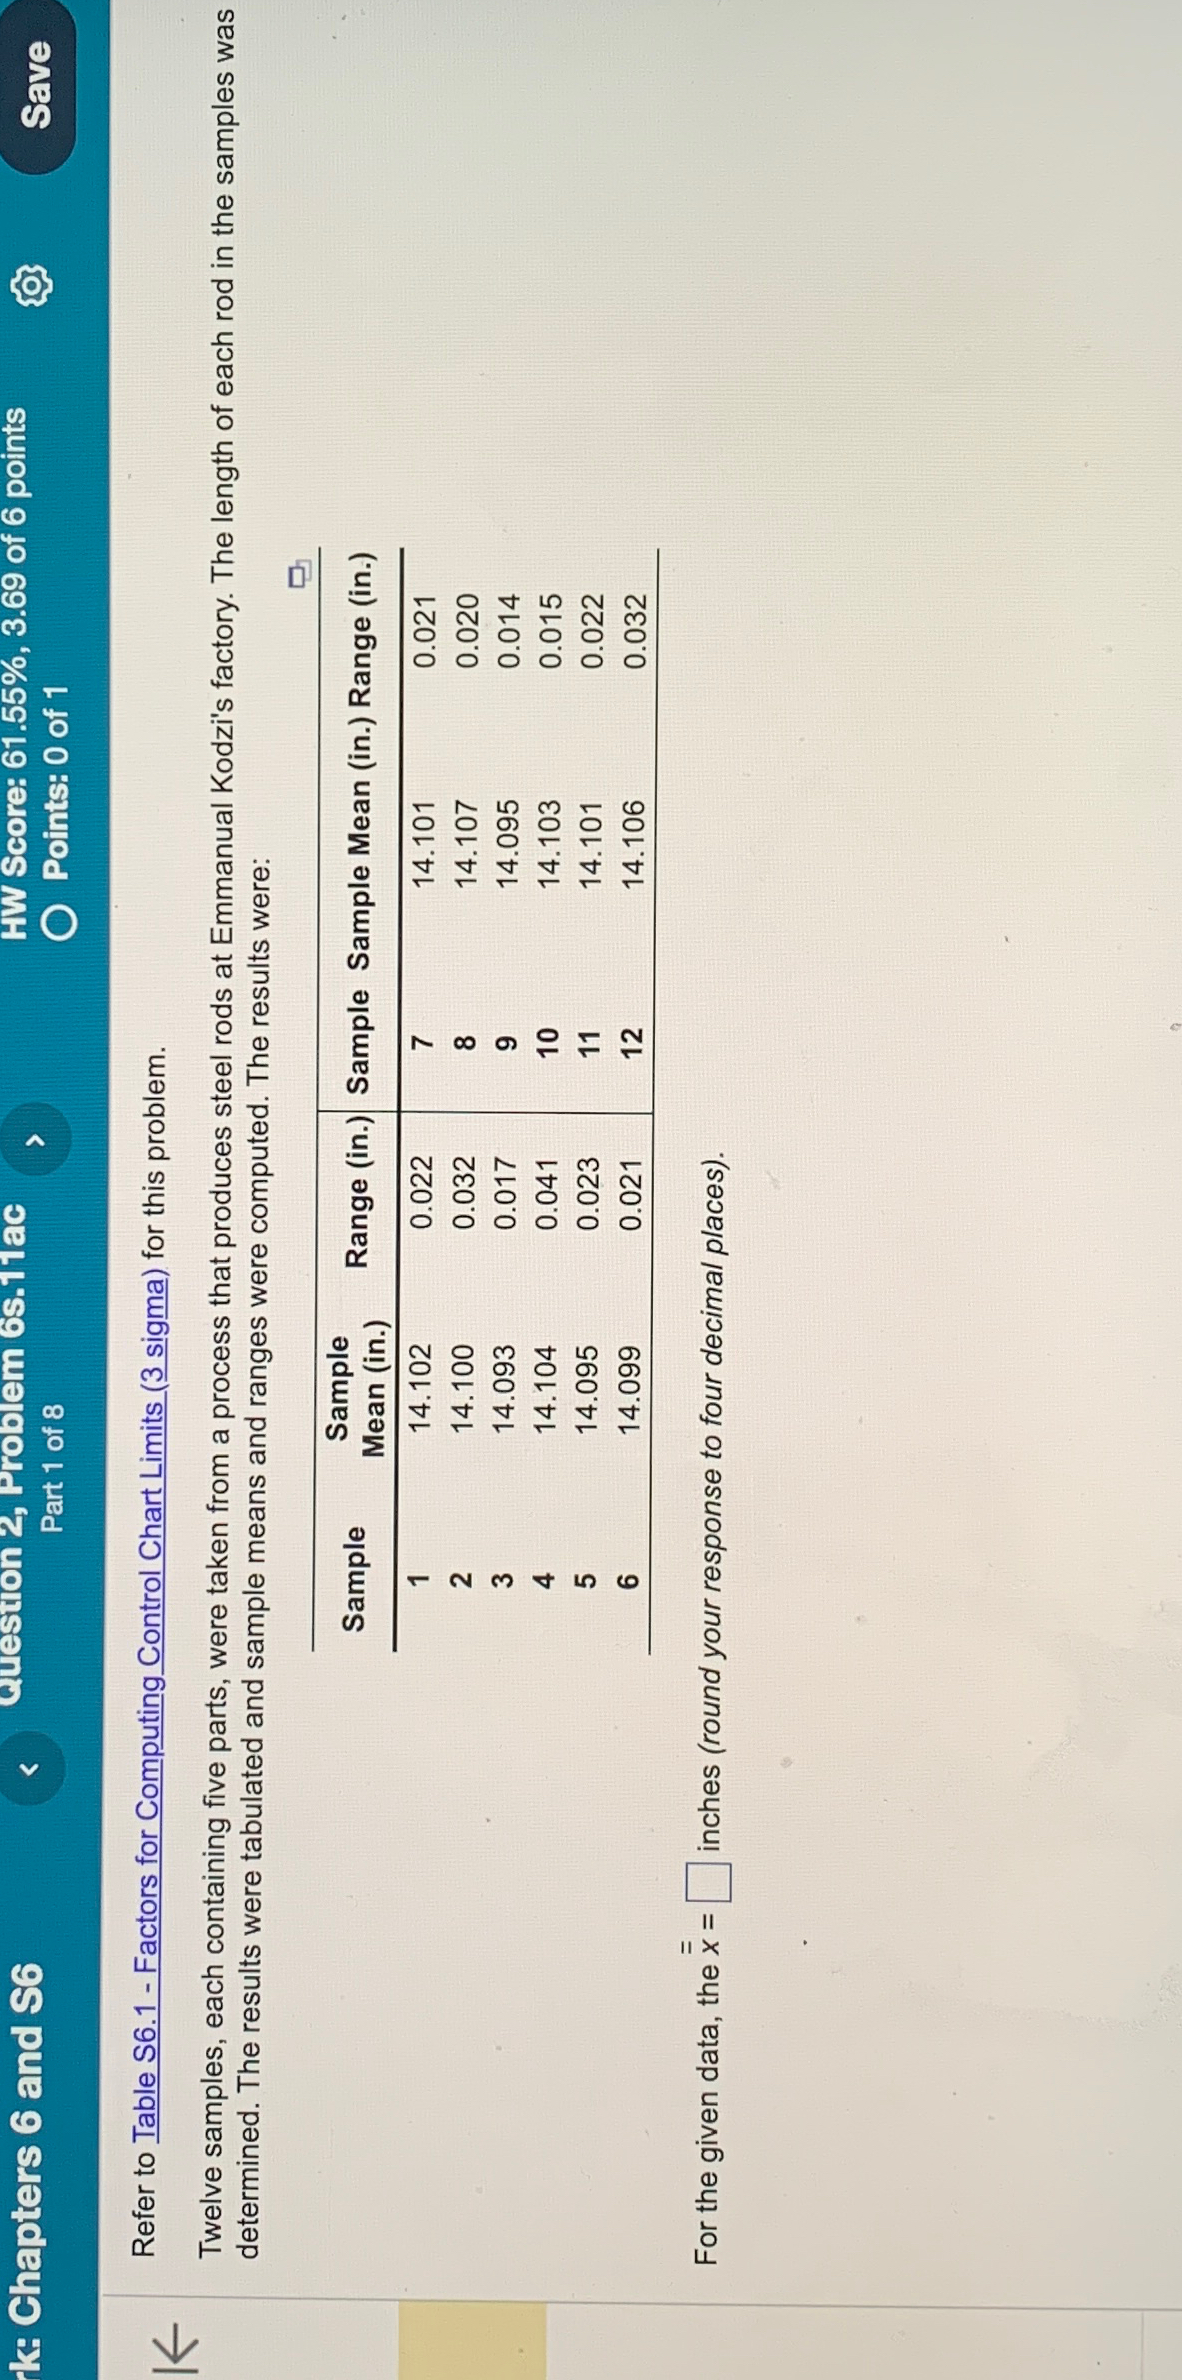
Twelve samples, each containing five parts, were taken from a process that produces steel rods at Emmanual Kodzi's factory. The length of each rod in the samples was determined. The results were tabulated and sample means and ranges were computed. The results were:
tableSampletableSampleMean inRange inSample Sample Mean in Range in
For the given data, the inches round your response to four decimal places
Step by Step Solution
There are 3 Steps involved in it
1 Expert Approved Answer
Step: 1 Unlock

Question Has Been Solved by an Expert!
Get step-by-step solutions from verified subject matter experts
Step: 2 Unlock
Step: 3 Unlock