

Question: K Click the icon to view the sample data. a. Based on the computations for the within- and between-sample variation, develop the ANOVA table
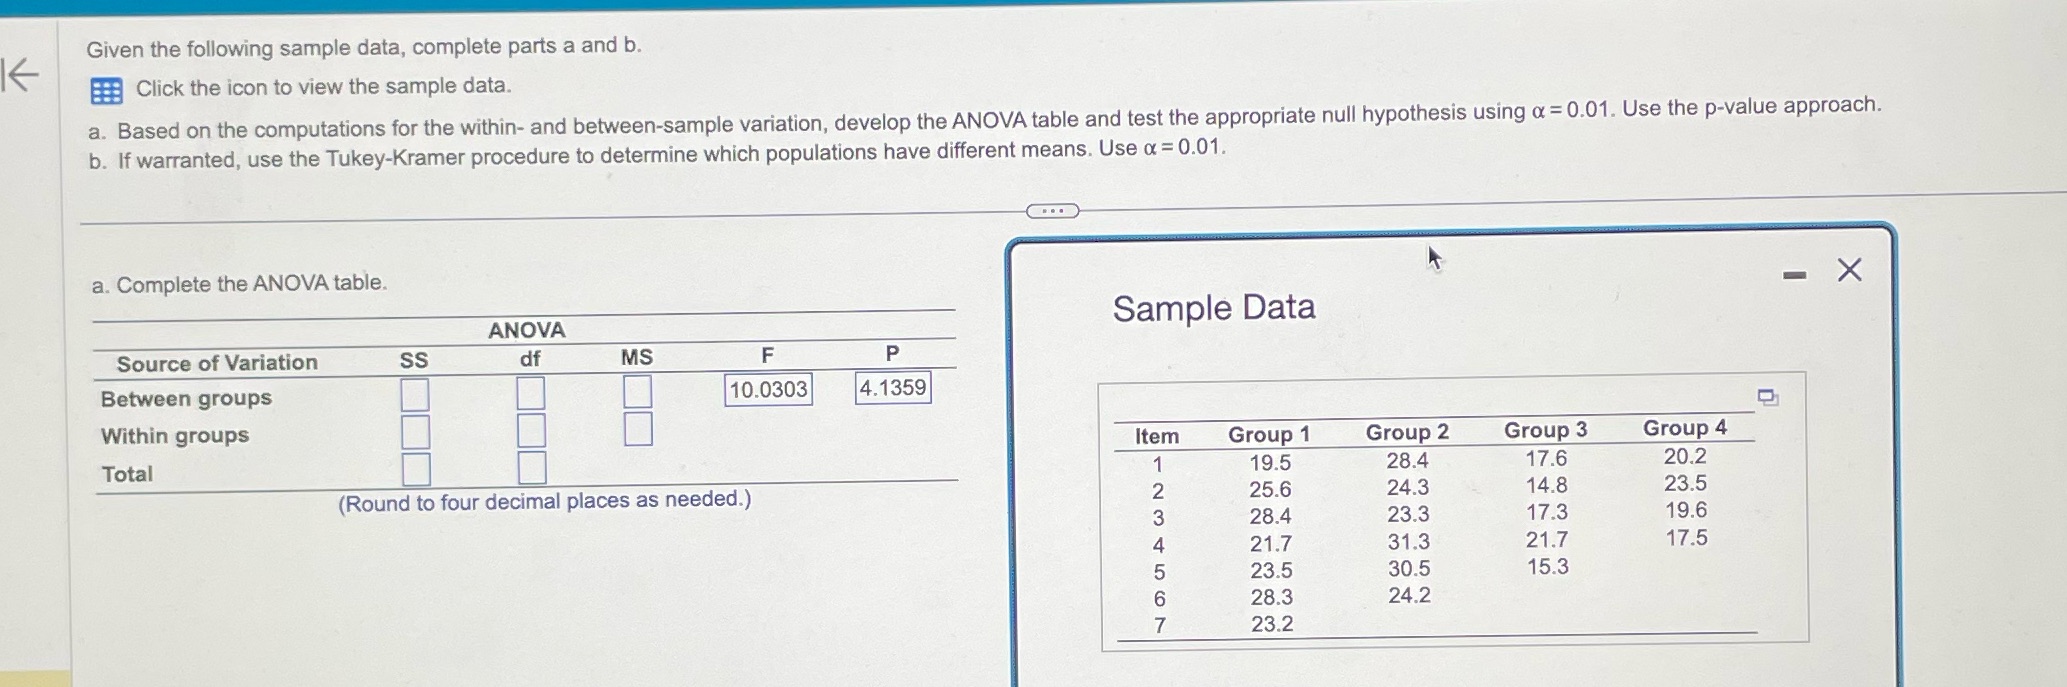
K Click the icon to view the sample data. a. Based on the computations for the within- and between-sample variation, develop the ANOVA table and test the appropriate null hypothesis using a 0.01. Use the p-value approach. b. If warranted, use the Tukey-Kramer procedure to determine which populations have different means. Use a = 0.01. Given the following sample data, complete parts a and b. a. Complete the ANOVA table. Sample Data Source of Variation SS ANOVA df MS F P Between groups 10.0303 4.1359 Within groups Total (Round to four decimal places as needed.) Item Group 1 Group 2 Group 3 1 19.5 28.4 17.6 Group 4 20.2 234569 25.6 24.3 14.8 23.5 28.4 23.3 17.3 19.6 21.7 31.3 21.7 17.5 23.5 30.5 15.3 28.3 24.2 7 23.2 - n
Step by Step Solution
There are 3 Steps involved in it

Get step-by-step solutions from verified subject matter experts