

Question: K Common-size statement analysis A common-size income statement for Creek Enterprises' 2018 operations follows Using the firm's 2019 income. statement develop the 2019 common-size
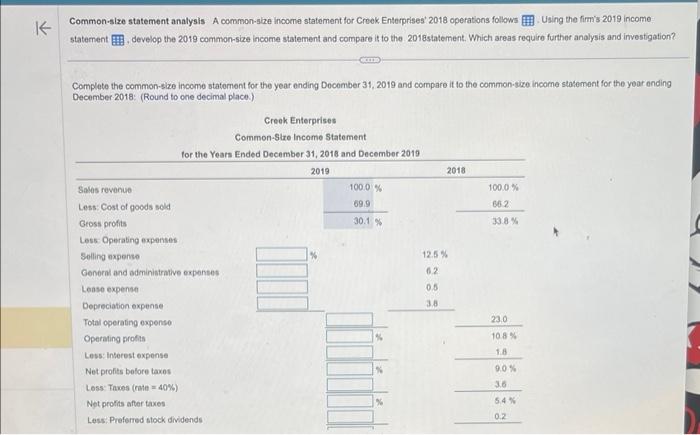
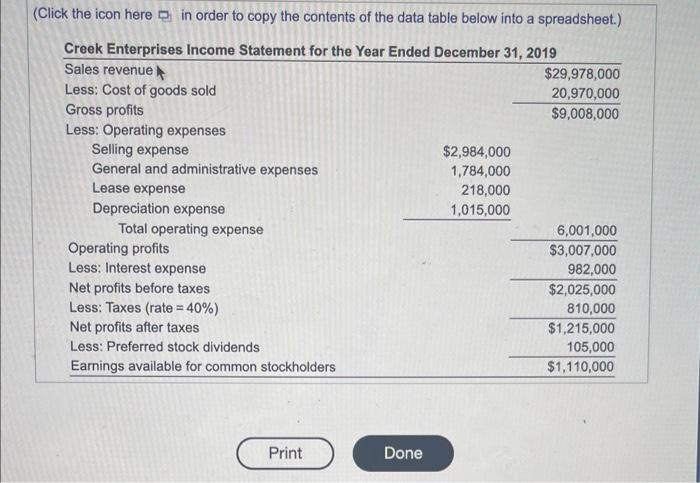
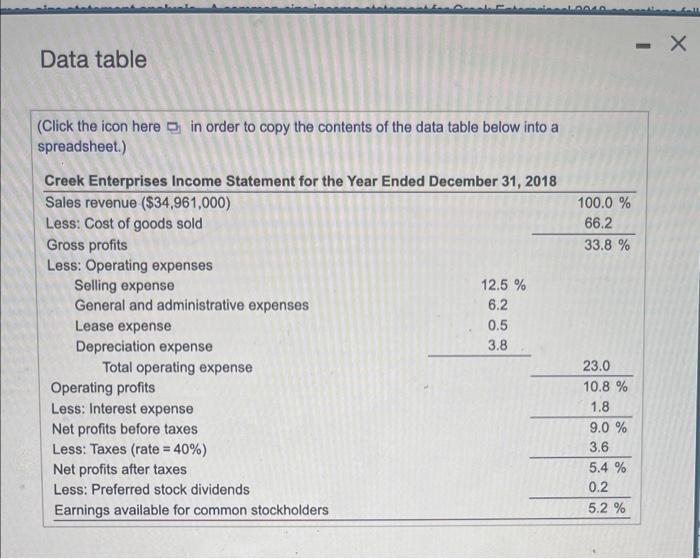
K Common-size statement analysis A common-size income statement for Creek Enterprises' 2018 operations follows Using the firm's 2019 income. statement develop the 2019 common-size income statement and compare it to the 2018statement. Which areas require further analysis and investigation? Complete the common-size income statement for the year ending December 31, 2019 and compare it to the common-size income statement for the year ending December 2018: (Round to one decimal place.) Creek Enterprises Common-Size Income Statement for the Years Ended December 31, 2018 and December 2019 Sales revenue Less: Cost of goods sold Gross profits Less: Operating expenses Selling expense General and administrative expenses Lease expense Depreciation expense Total operating expense Operating profits Less: Interest expense Net profits before taxes Less: Taxes (rate 40%) Net profits after taxes Less: Preferred stock dividends 2019 100.0 % 69.9 30.1 % 12.5% 6.2 0.5 3.8 2018 100.0% 66.2 33.8% 23.0 10.8 % 1.8 9.0% 3.6 5.4% 0.2 (Click the icon here in order to copy the contents of the data table below into a spreadsheet.) Creek Enterprises Income Statement for the Year Ended December 31, 2019 Sales revenue $29,978,000 Less: Cost of goods sold 20,970,000 Gross profits $9,008,000 Less: Operating expenses Selling expense $2,984,000 General and administrative expenses 1,784,000 Lease expense 218,000 Depreciation expense 1,015,000 Total operating expense 6,001,000 Operating profits Less: Interest expense Net profits before taxes Less: Taxes (rate = 40%) Net profits after taxes Less: Preferred stock dividends Earnings available for common stockholders Print Done $3,007,000 982,000 $2,025,000 810,000 $1,215,000 105,000 $1,110,000 Data table (Click the icon here in order to copy the contents of the data table below into a spreadsheet.) Creek Enterprises Income Statement for the Year Ended December 31, 2018 Sales revenue ($34,961,000) 100.0 % 66.2 - X Less: Cost of goods sold Gross profits 33.8 % Less: Operating expenses Selling expense 12.5 % General and administrative expenses 6.2 Lease expense 0.5 Depreciation expense 3.8 Total operating expense 23.0 10.8 % Operating profits Less: Interest expense 1.8 Net profits before taxes 9.0% Less: Taxes (rate = 40%) 3.6 Net profits after taxes Less: Preferred stock dividends Earnings available for common stockholders 5.4 % 0.2 5.2%
Step by Step Solution
There are 3 Steps involved in it

Get step-by-step solutions from verified subject matter experts