

Question: K Frequency Click here to view the sample data Click here to view the table of critical values for normal probability plots a Draw a
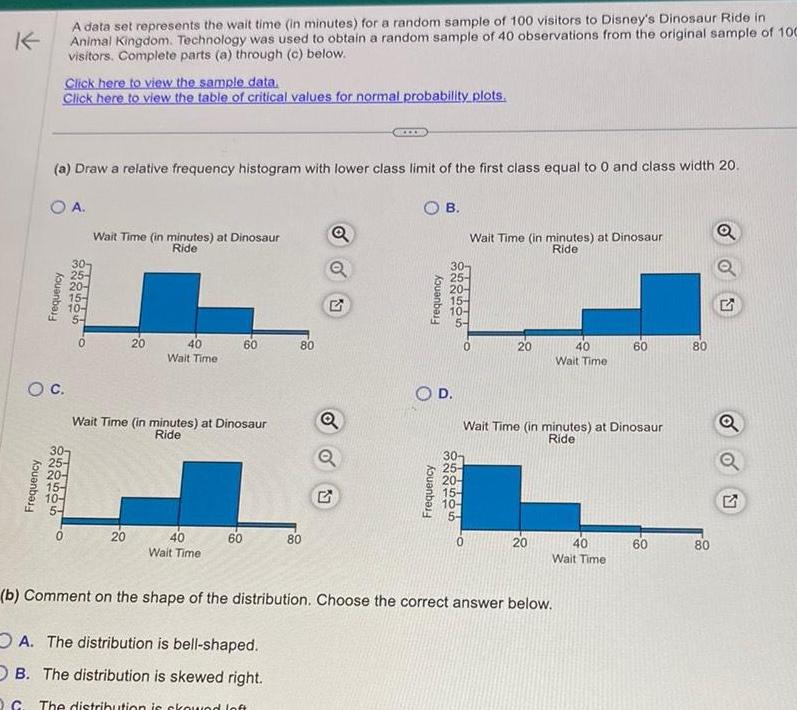

K Frequency Click here to view the sample data Click here to view the table of critical values for normal probability plots a Draw a relative frequency histogram with lower class limit of the first class equal to 0 and class width 20 O A OB Frequency O C A data set represents the wait time in minutes for a random sample of 100 visitors to Disney s Dinosaur Ride in Animal Kingdom Technology was used to obtain a random sample of 40 observations from the original sample of 100 visitors Complete parts a through c below ONW 25 Wait Time in minutes at Dinosaur Ride 20 20 40 Wait Time Wait Time in minutes at Dinosaur Ride 40 Wait Time 60 60 80 80 Q Q Q G Frequency Frequency 30 25 3221 O D Wait Time in minutes at Dinosaur Ride 30 25 0 20 Wait Time in minutes at Dinosaur Ride 20 40 Wait Time 40 Wait Time b Comment on the shape of the distribution Choose the correct answer below A The distribution is bell shaped OB The distribution is skewed right QC The distribution is ckownd loft 60 8 9 60 80 80 G Q Q
Step by Step Solution
There are 3 Steps involved in it

Get step-by-step solutions from verified subject matter experts