

Question: K One graph in the figure represents a normal distribution with mean u = 16 and standard deviation o = 3. The other graph represents
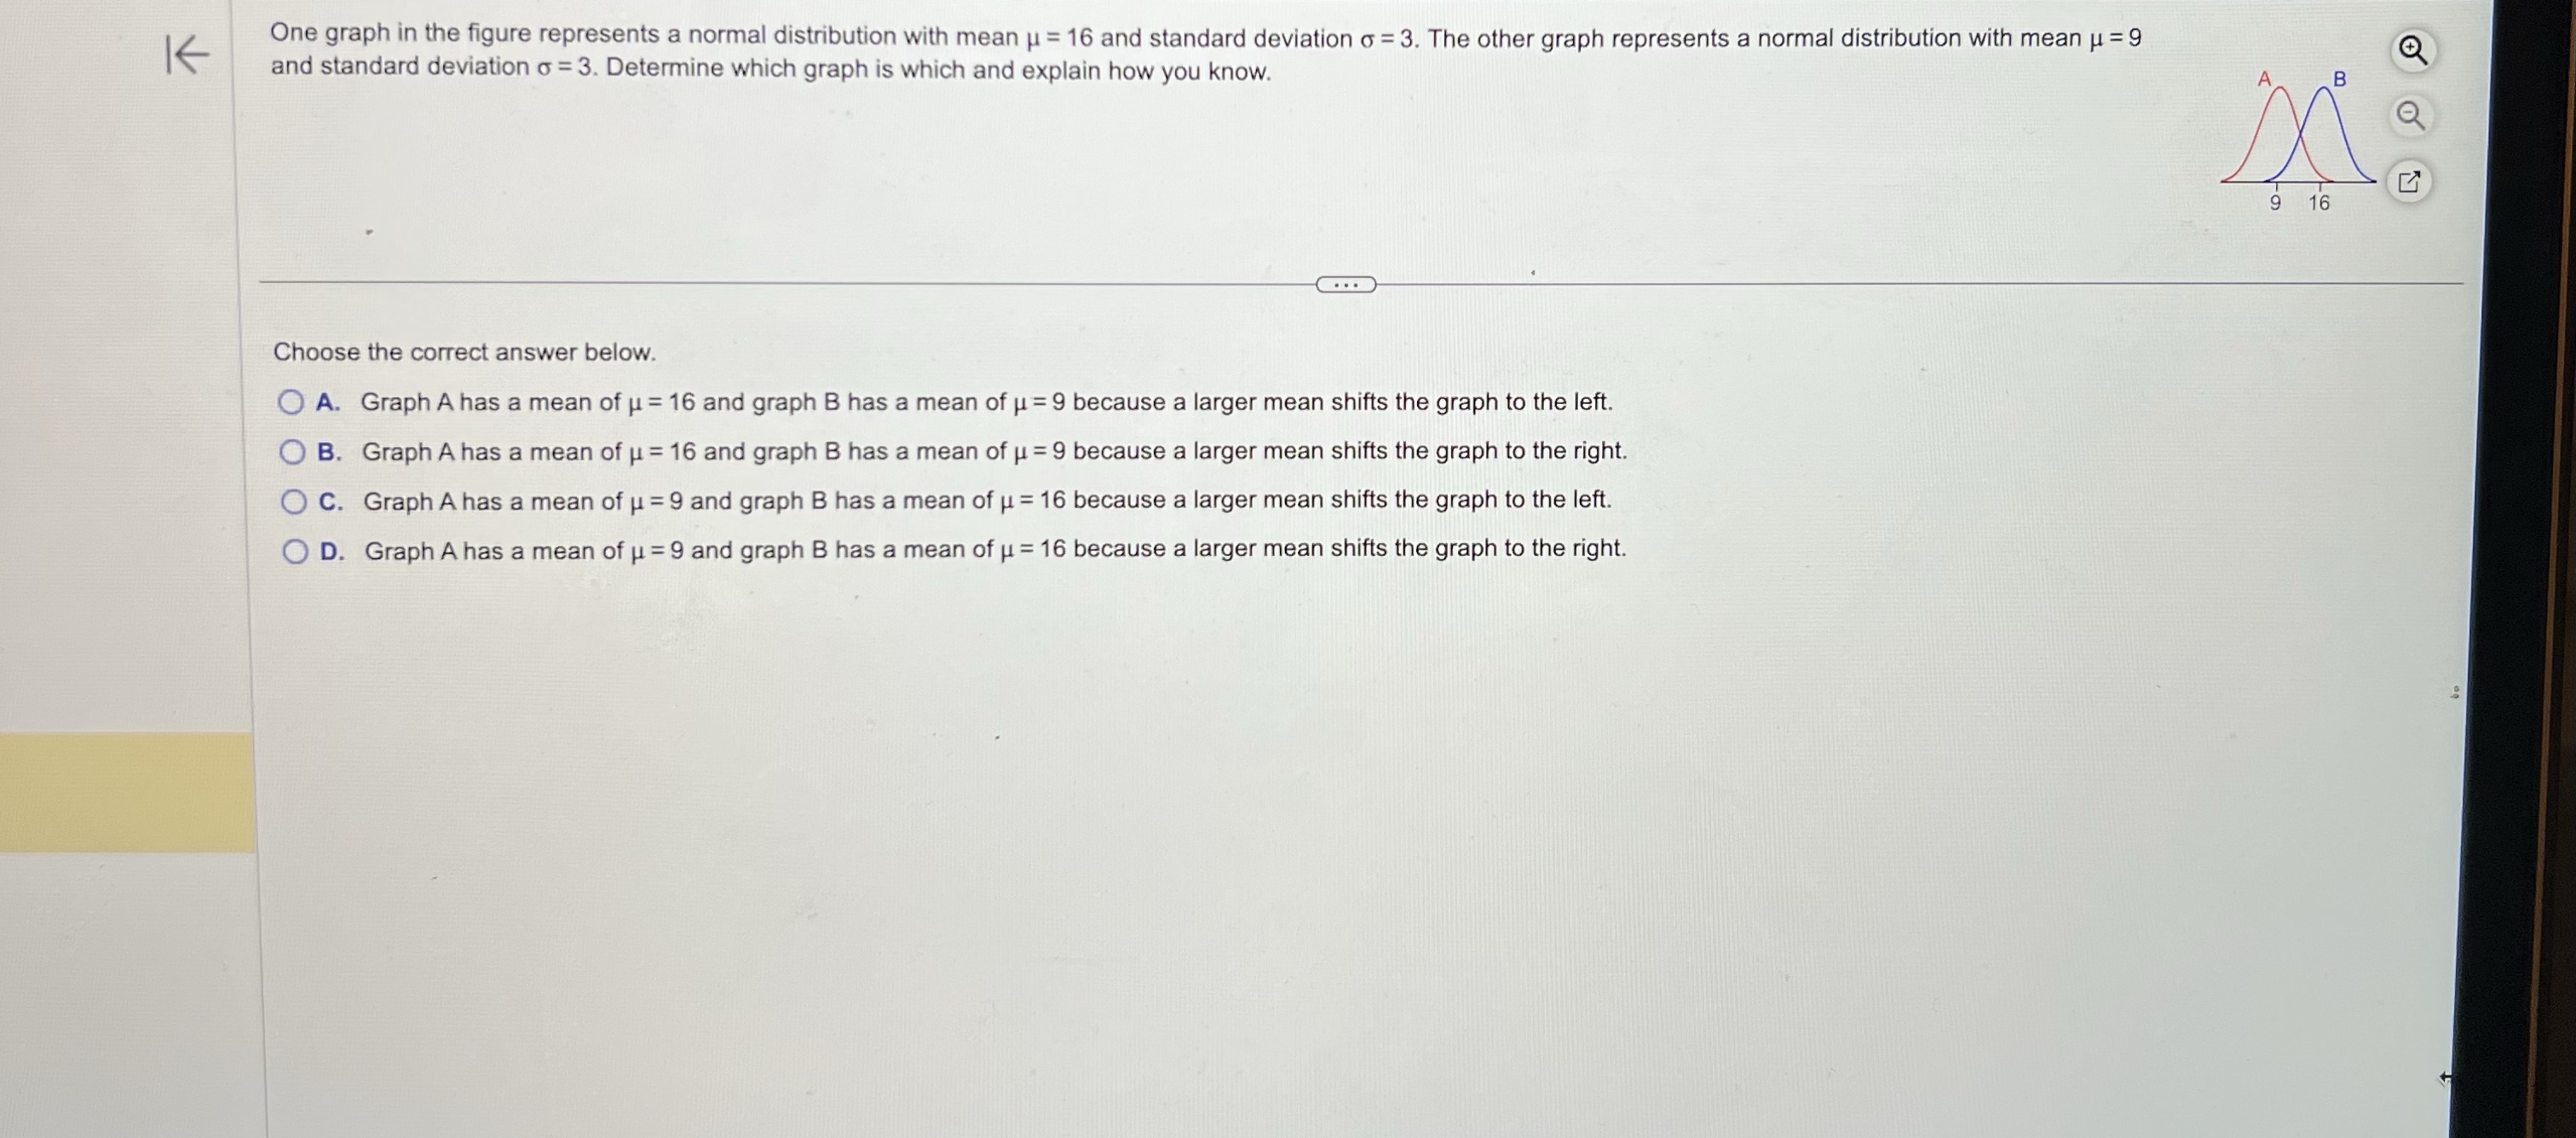
K One graph in the figure represents a normal distribution with mean u = 16 and standard deviation o = 3. The other graph represents a normal distribution with mean u = 9 and standard deviation o = 3. Determine which graph is which and explain how you know. 9 16 Choose the correct answer below. O A. Graph A has a mean of u = 16 and graph B has a mean of u = 9 because a larger mean shifts the graph to the left. O B. Graph A has a mean of u = 16 and graph B has a mean of u = 9 because a larger mean shifts the graph to the right. O C. Graph A has a mean of u = 9 and graph B has a mean of u = 16 because a larger mean shifts the graph to the left. O D. Graph A has a mean of u = 9 and graph B has a mean of u = 16 because a larger mean shifts the graph to the right
Step by Step Solution
There are 3 Steps involved in it

Get step-by-step solutions from verified subject matter experts