

Question: K The histogram and cumulative percentage polygon below visualize the property taxes per capita for 64 locations. What conclusions can you reach concerning the
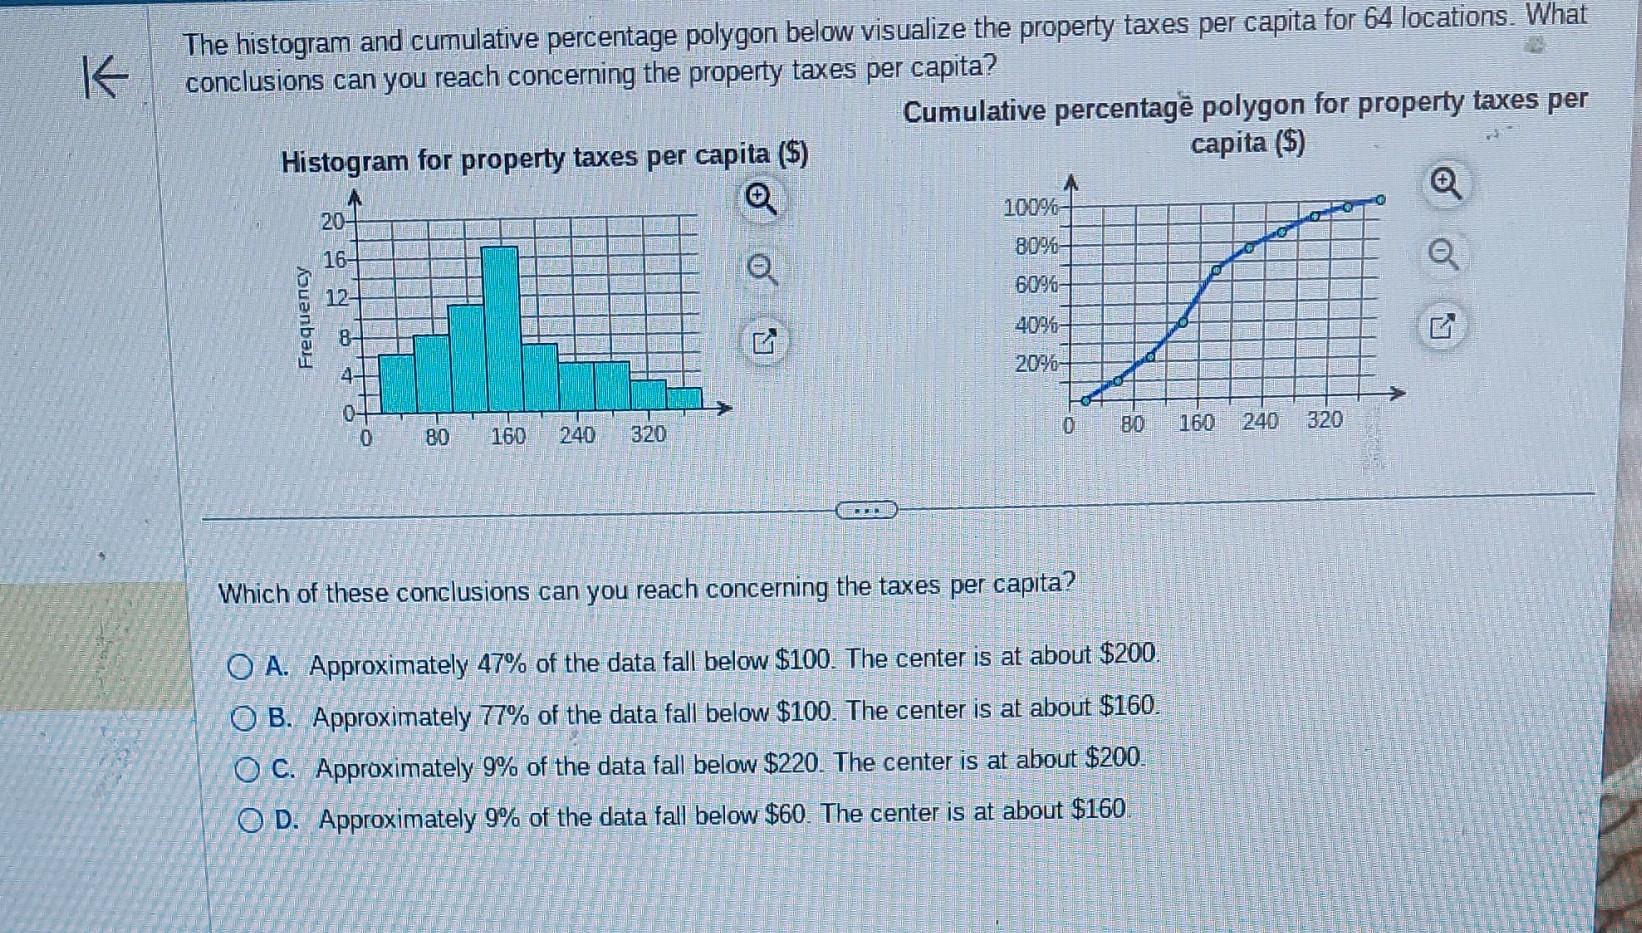
K The histogram and cumulative percentage polygon below visualize the property taxes per capita for 64 locations. What conclusions can you reach concerning the property taxes per capita? Histogram for property taxes per capita ($) A Frequency 20- 16- 12 4. 0 80 160 240 320 0 G Cumulative percentage polygon for property taxes per capita ($) 100% 80%- 60%- 40% 20%- 10 Lo 80 160 240 320 Which of these conclusions can you reach concerning the taxes per capita? OA. Approximately 47% of the data fall below $100. The center is at about $200. OB. Approximately 77% of the data fall below $100. The center is at about $160. OC. Approximately 9% of the data fall below $220. The center is at about $200. OD. Approximately 9% of the data fall below $60. The center is at about $160. G
Step by Step Solution
3.51 Rating (148 Votes )
There are 3 Steps involved in it
The image shows a histogram and a cumulative percentage polygon for property taxes per capita We nee... View full answer

Get step-by-step solutions from verified subject matter experts