

Question: K What is the coefficient of determination for Data Set B? The coefficient of determination for Data Set B is %. Full Data Set: Data
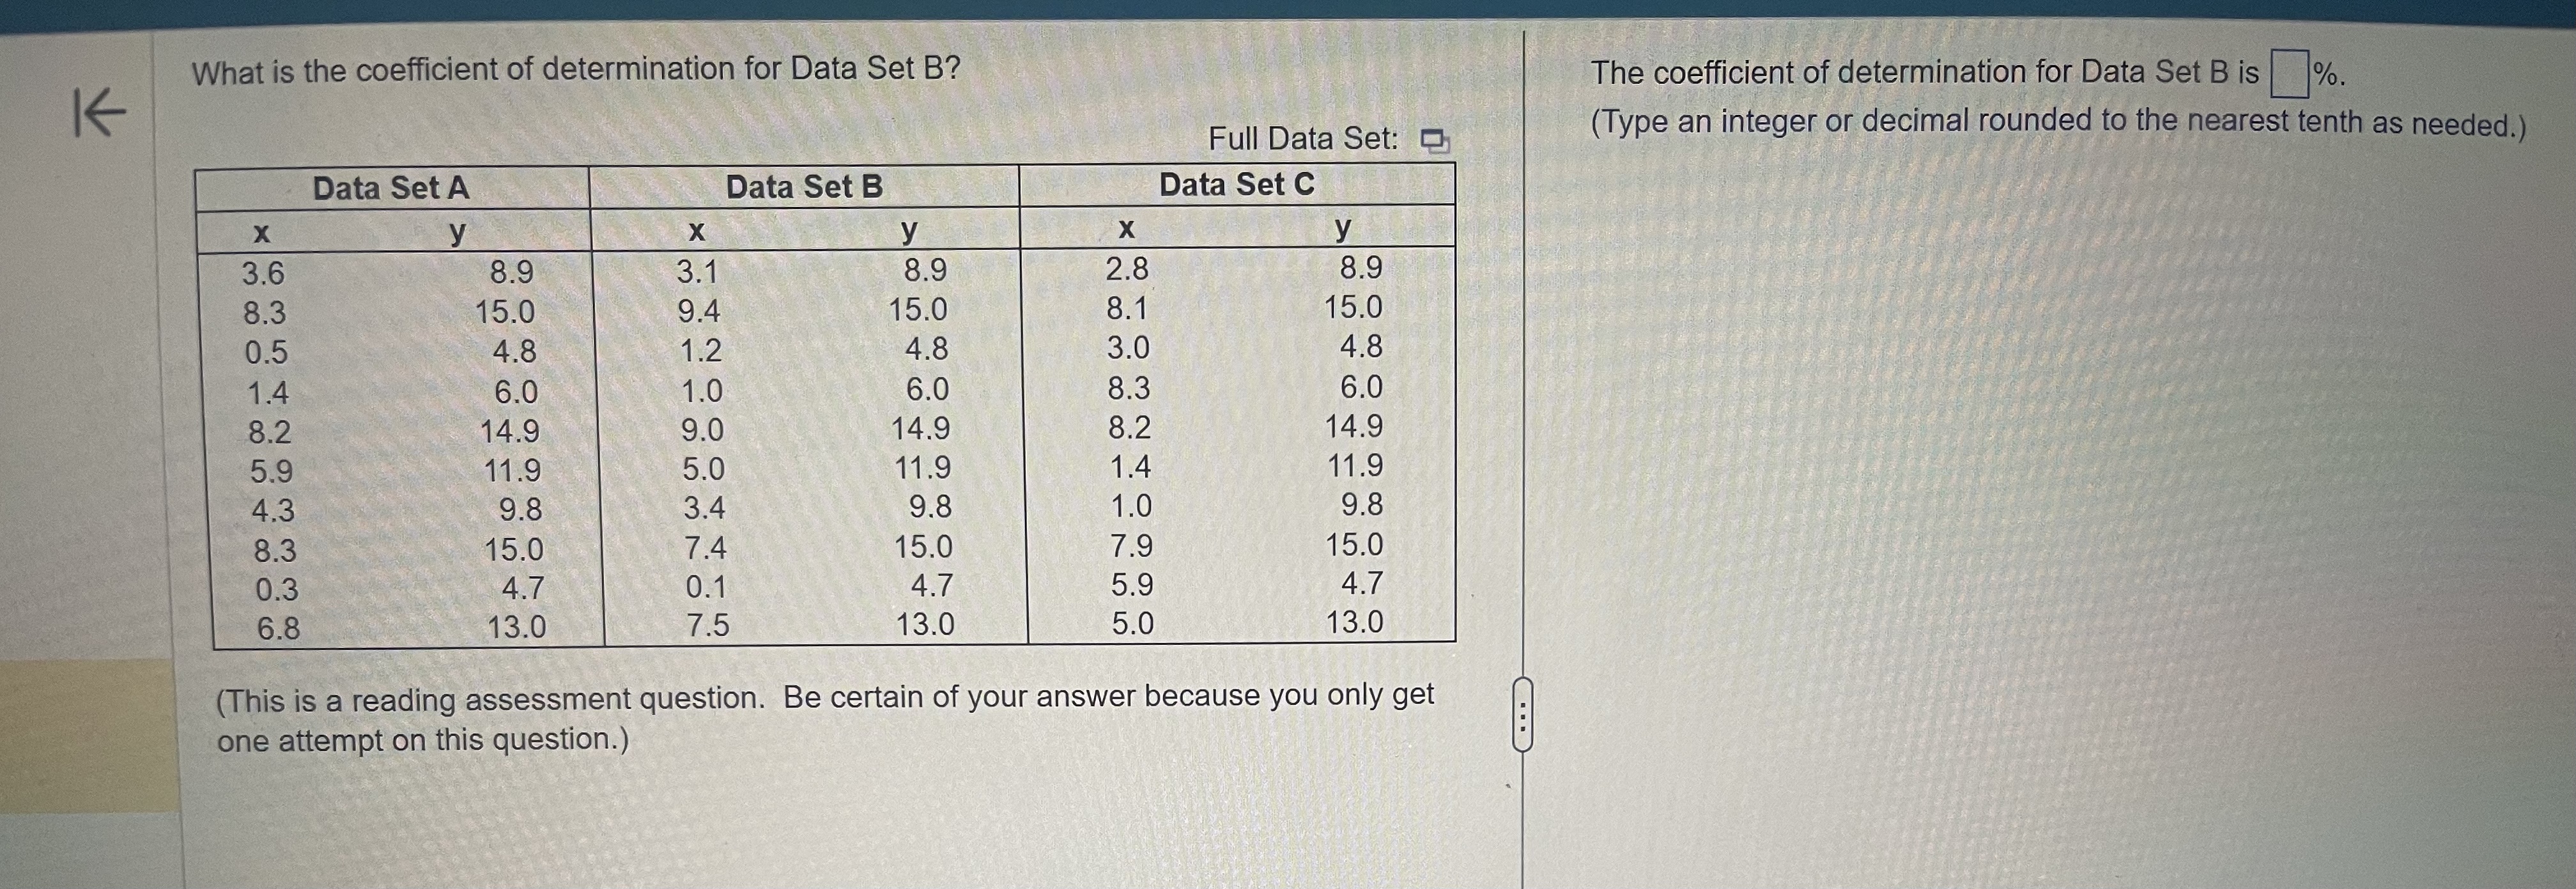
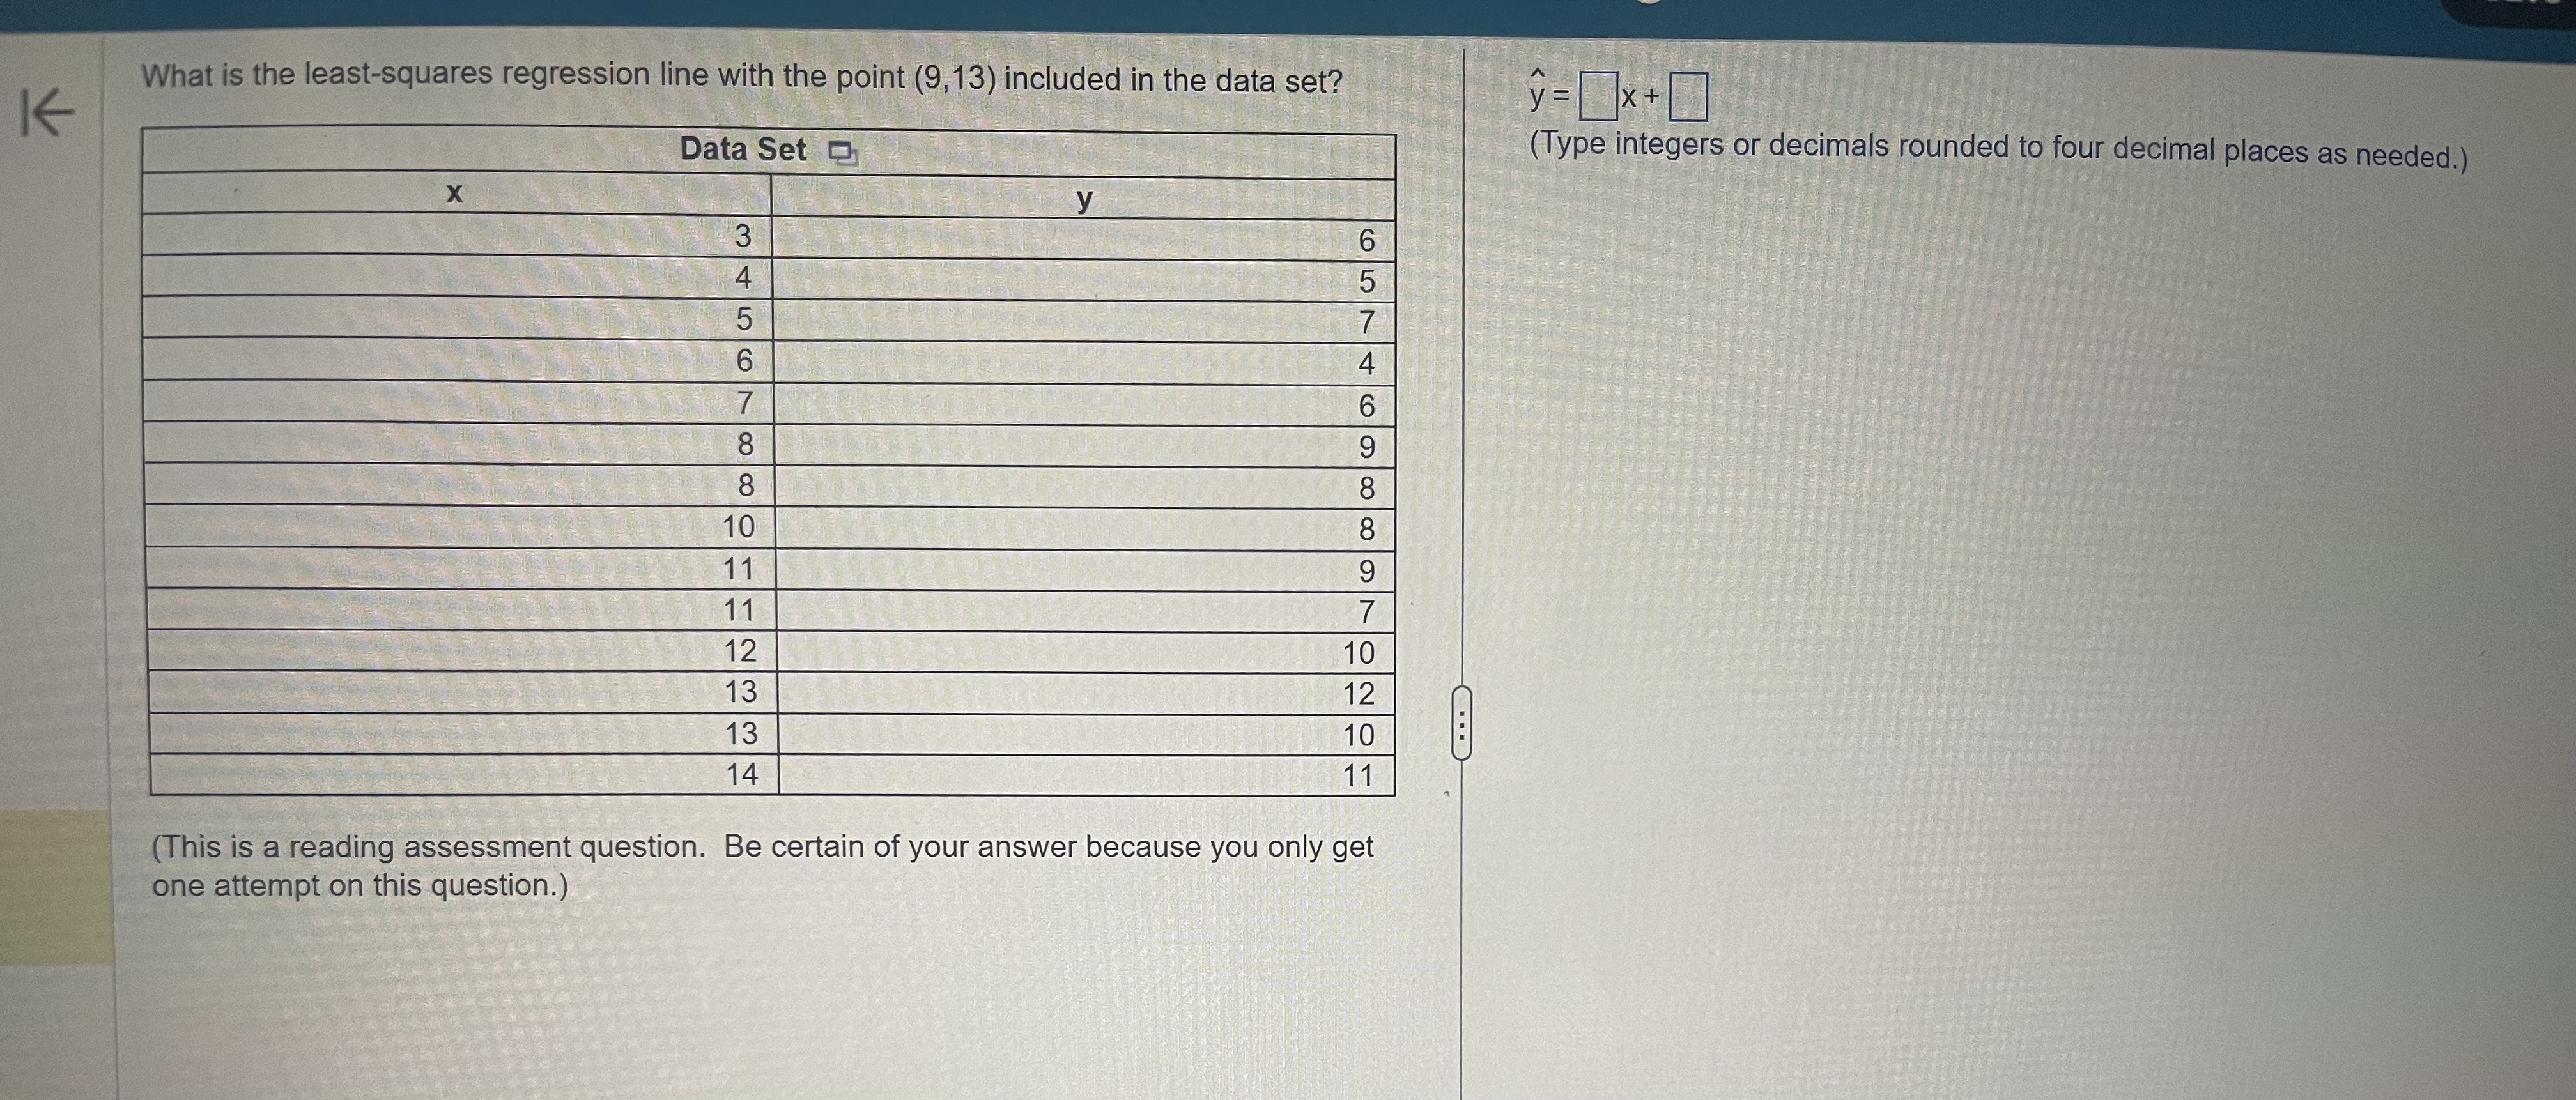
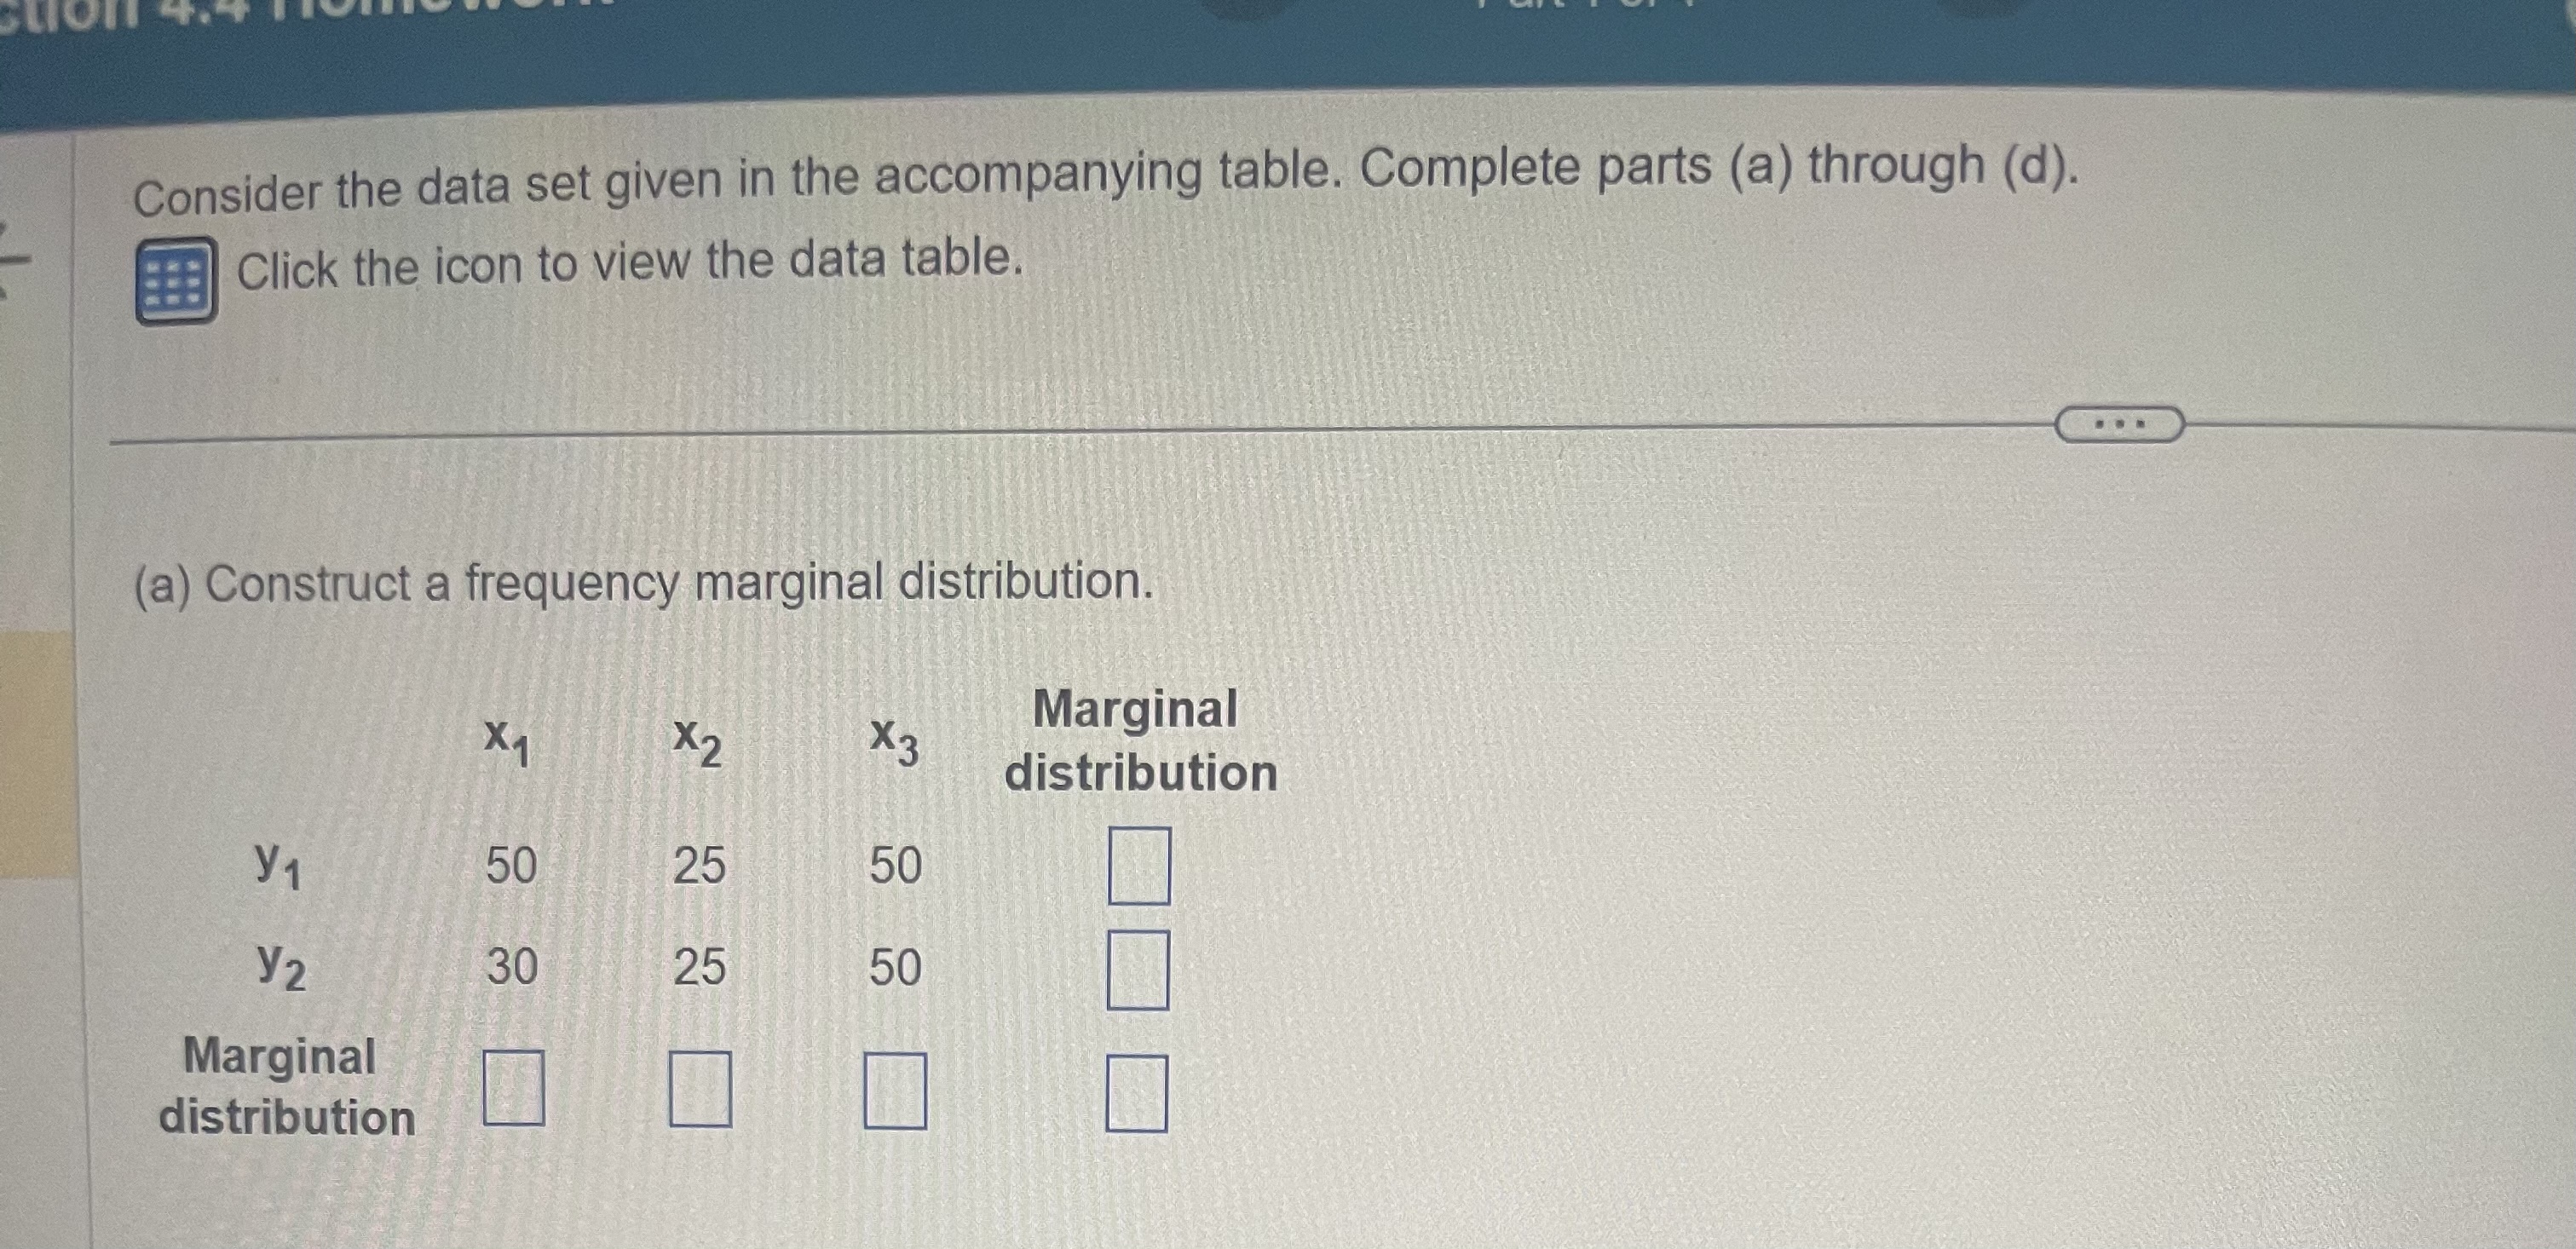

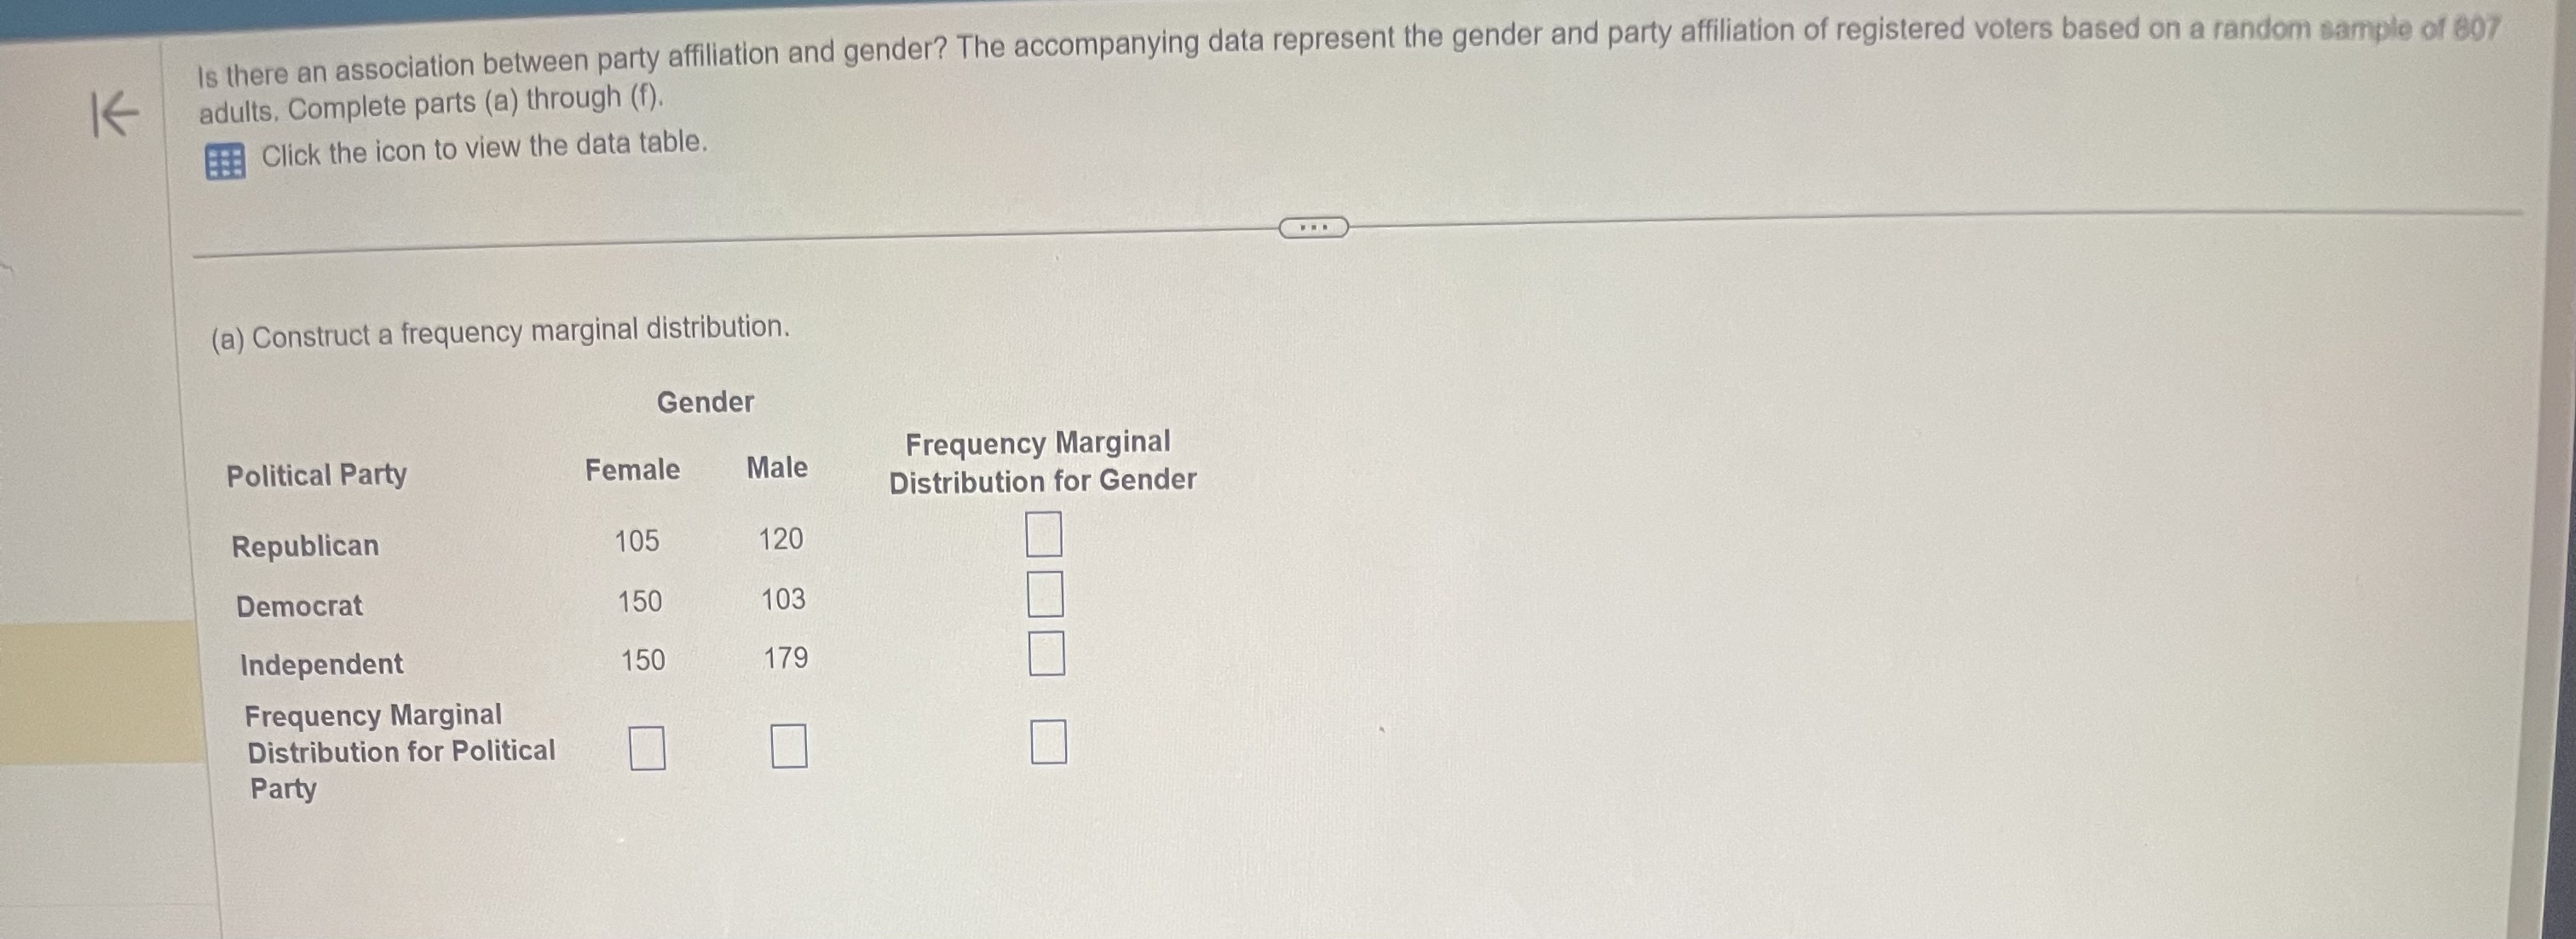
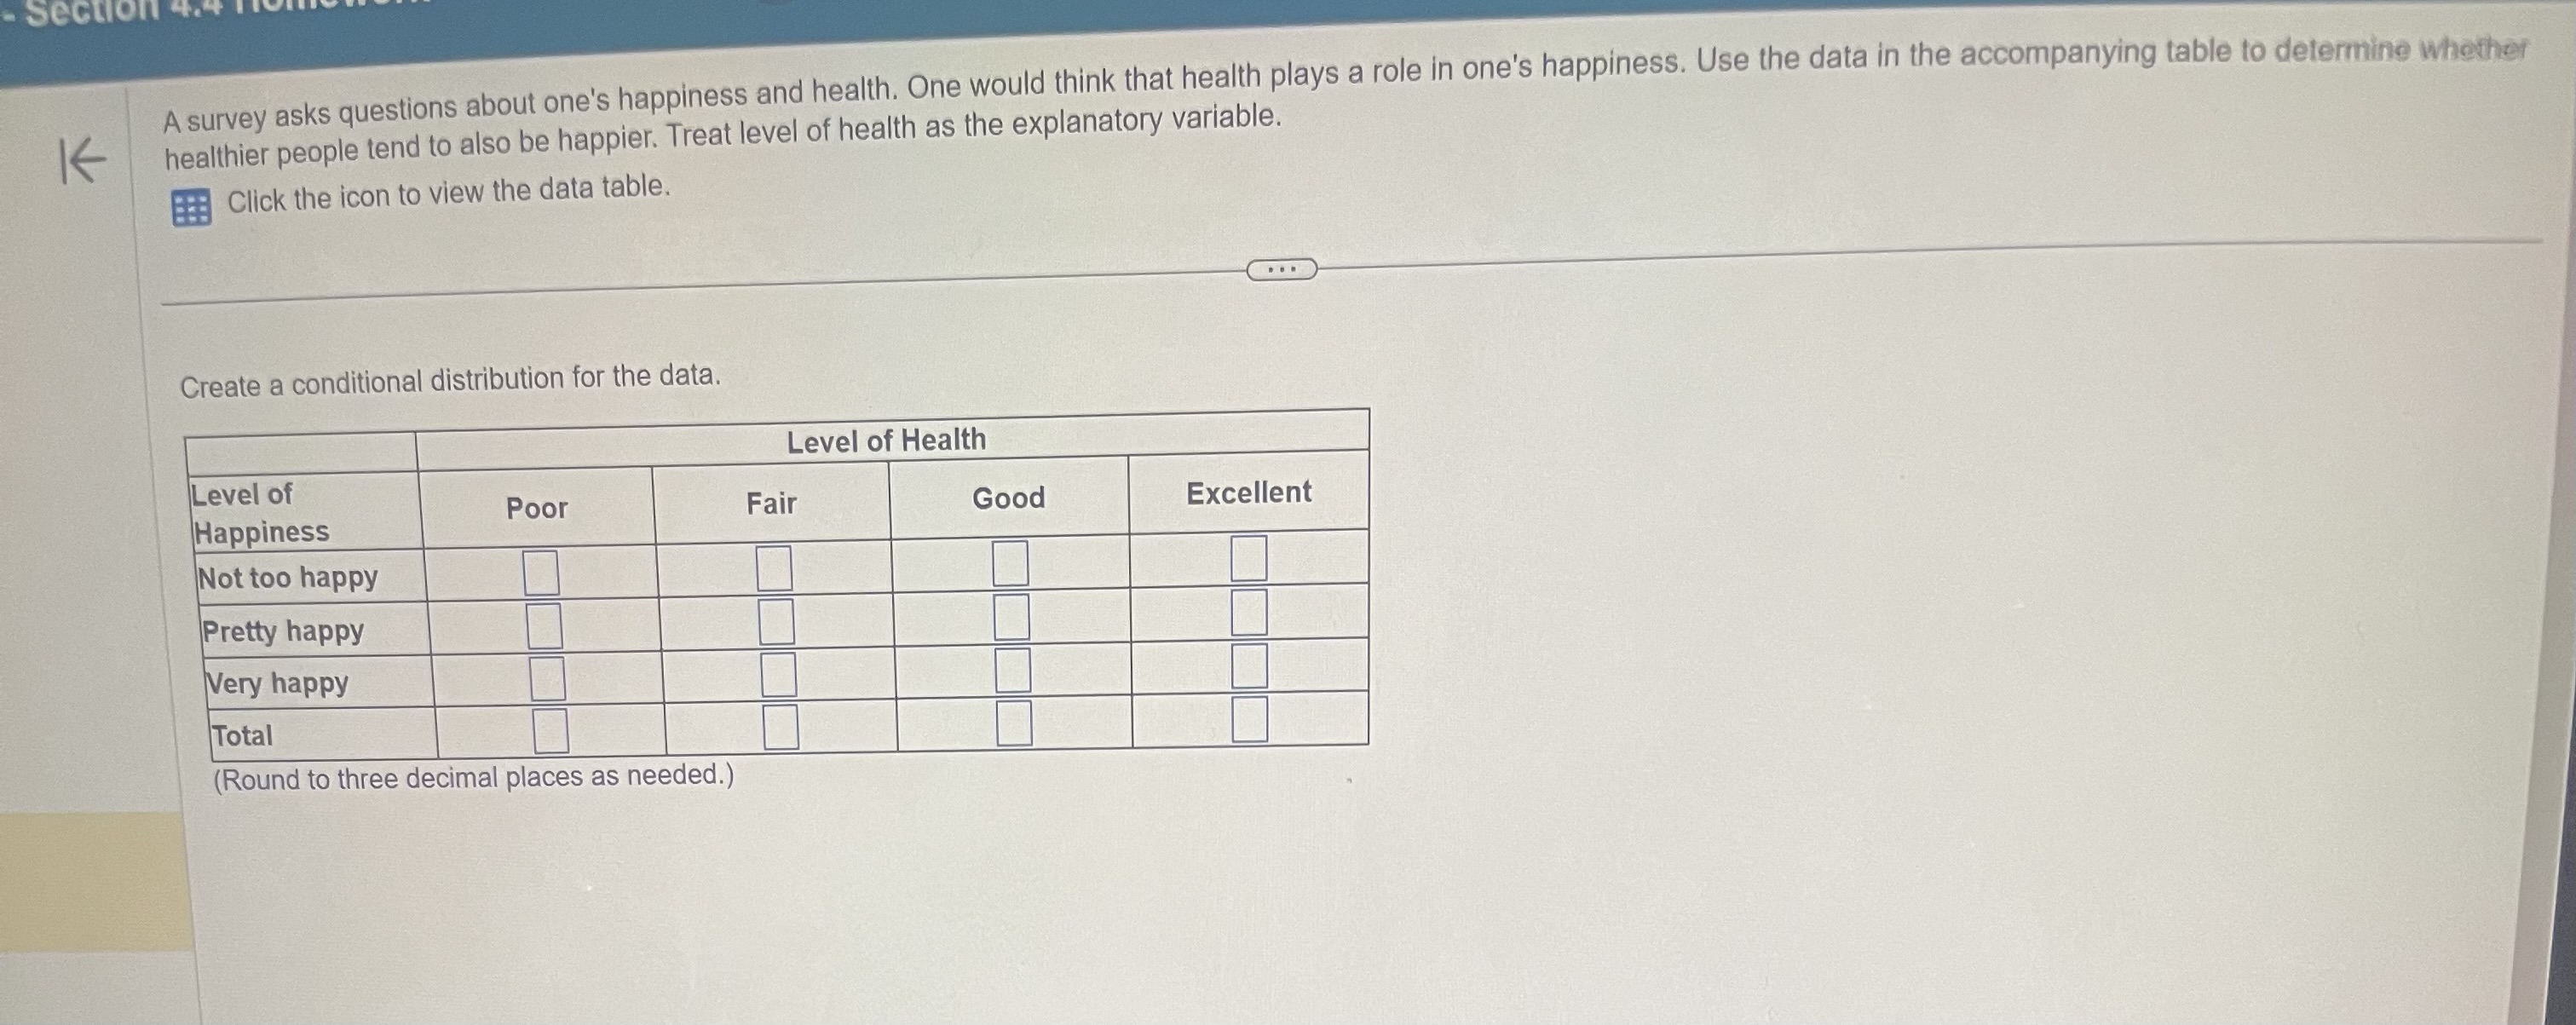
K What is the coefficient of determination for Data Set B? The coefficient of determination for Data Set B is %. Full Data Set: Data Set A (Type an integer or decimal rounded to the nearest tenth as needed.) Data Set B Data Set C X y X y X 3.6 8.9 y 3.1 8.9 8.3 2.8 8.9 15.0 9.4 15.0 8.1 0.5 15.0 4.8 1.2 4.8 3.0 1.4 4.8 6.0 1.0 6.0 8.2 8.3 14.9 6.0 9.0 14.9 5.9 8.2 11.9 14.9 5.0 11.9 1.4 4.3 11.9 9.8 3.4 9.8 8.3 1.0 15.0 9.8 7.4 15.0 0.3 7.9 4.7 15.0 0.1 4.7 5.9 6.8 13.0 4.7 7.5 13.0 5.0 13.0 (This is a reading assessment question. Be certain of your answer because you only get one attempt on this question.)What is the least-squares regression line with the point (9,13) included in the data set? K y = x + 0 Data Set (Type integers or decimals rounded to four decimal places as needed.) X y 3 6 A 5 107 7 6 4 00 00 9 8 10 8 11 9 11 7 12 10 13 12 13 10 14 11 (This is a reading assessment question. Be certain of your answer because you only get one attempt on this question.)Consider the data set given in the accompanying table. Complete parts (a) through (d). Click the icon to view the data table. (a) Construct a frequency marginal distribution. Marginal X 1 X2 X3 distribution y1 50 25 50 y2 30 25 50 Marginal distributionIn an effort to gauge how the country's population feels about the immigration, researchers surveyed adult citizens. One question asked was, "On the whole, do you think immigration is a good thing or a bad thing for this country today?" The results of the survey, by ethnicity, are given in the acompanying table. Complete parts (a) through (f). Click the icon to view the data table. (a) How many adult citizens were surveyed?Is there an association between party affiliation and gender? The accompanying data represent the gender and party affiliation of registered voters based on a random sample of 807 K adults, Complete parts (a) through (f). Click the icon to view the data table. (a) Construct a frequency marginal distribution. Gender Political Party Female Male Frequency Marginal Distribution for Gender Republican 105 120 Democrat 150 103 Independent 150 179 Frequency Marginal Distribution for Political PartySection A survey asks questions about one's happiness and health. One would think that health plays a role in one's happiness. Use the data in the accompanying table to determine whether K healthier people tend to also be happier. Treat level of health as the explanatory variable. Click the icon to view the data table. . . . Create a conditional distribution for the data. Level of Health Level of Poor Fair Good Excellent Happiness Not too happy Pretty happy Very happy Total (Round to three decimal places as needed.)
Step by Step Solution
There are 3 Steps involved in it

Get step-by-step solutions from verified subject matter experts