

Question: Kanban board Cycle time Velocity chart Planned value Mood chart Burndown chart Net promoter score Information radiator Product roadmap A . Shows the amount of
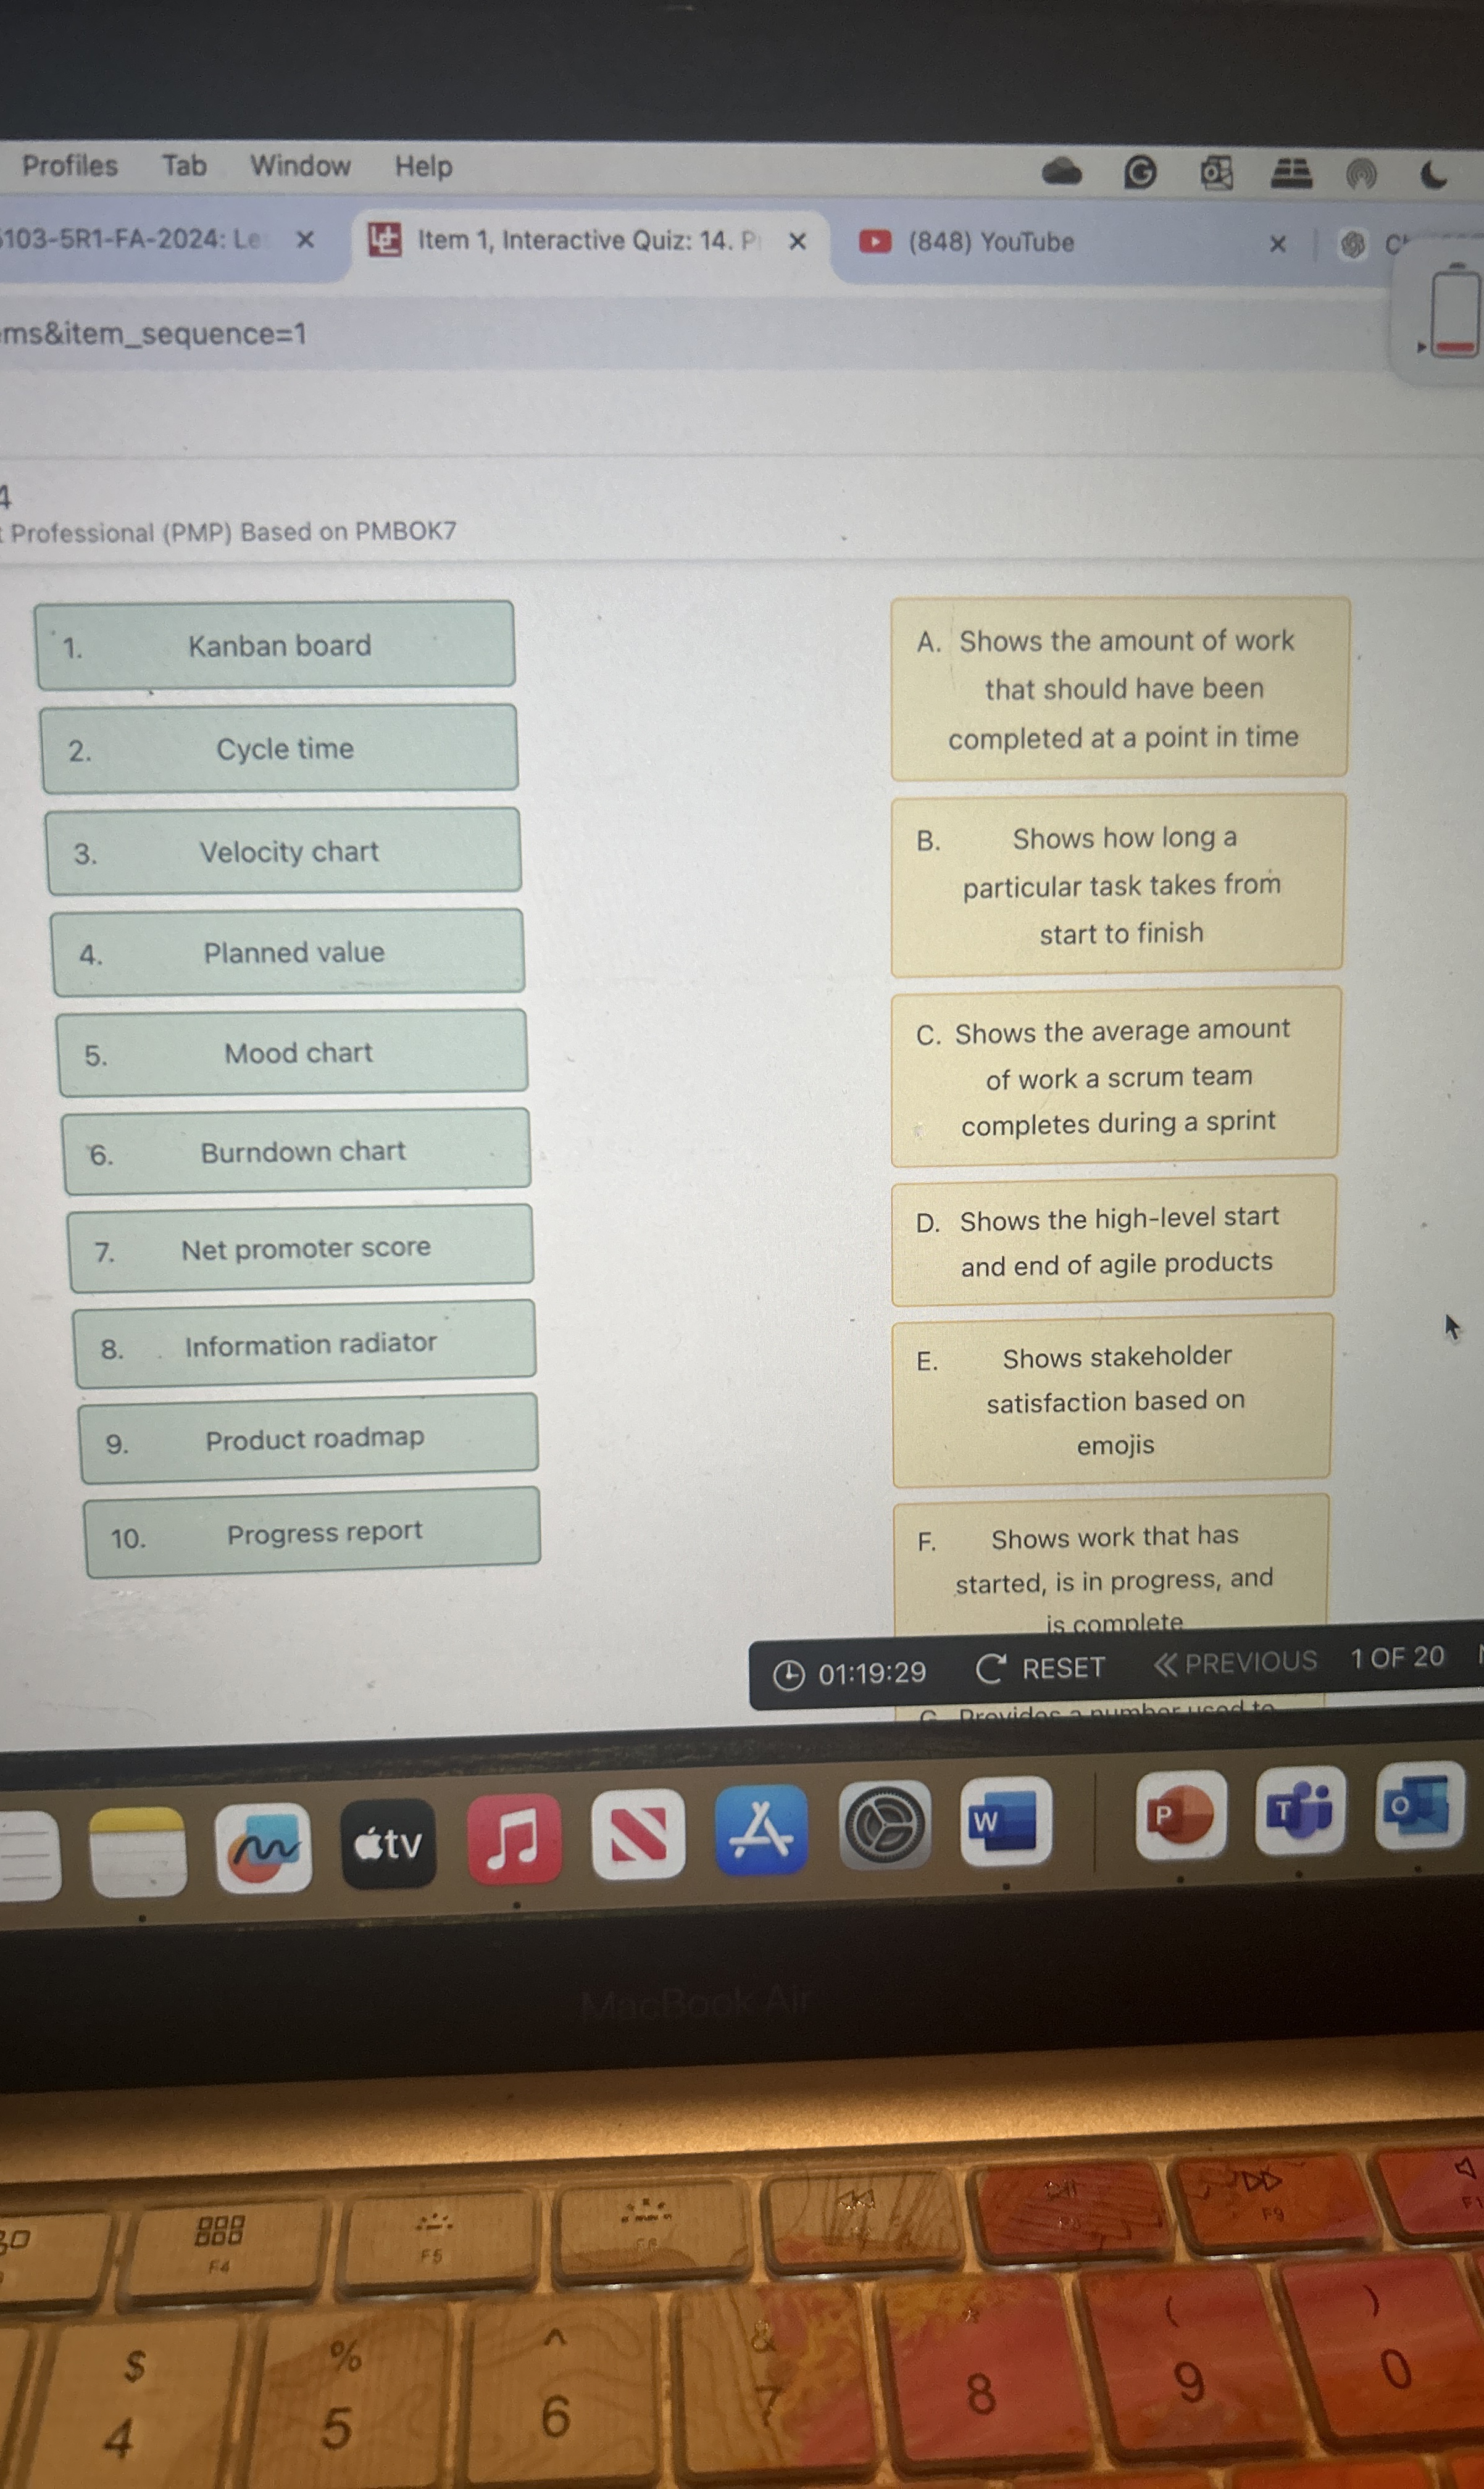
Kanban board
Cycle time
Velocity chart
Planned value
Mood chart
Burndown chart
Net promoter score
Information radiator
Product roadmap
A Shows the amount of work
that should have been
completed at a point in time
B Shows how long a
particular task takes from
start to finish
C Shows the average amount
of work a scrum team
completes during a sprint
D Shows the highlevel start
and end of agile products
E Shows stakeholder
satisfaction based on
emojis
F Shows work that has
started, is in progress, and
iscomolete.
Step by Step Solution
There are 3 Steps involved in it
1 Expert Approved Answer
Step: 1 Unlock

Question Has Been Solved by an Expert!
Get step-by-step solutions from verified subject matter experts
Step: 2 Unlock
Step: 3 Unlock