

Question: Keep in mind that you are comparing two Alternatives, so you will have two sets of Cash Flows, etc. For the Incremental Cash Flows ,
Keep in mind that you are comparing two Alternatives, so you will have two sets of Cash Flows, etc.
For theIncremental Cash Flows, let Delta mean "change in." Let T = Taxes at the given rate. Then...
Incremental Cash Flow per year = (Delta Revenue - Delta Expenses)(1 - T) + (Delta Depreciation x T).
Do your setup horizontally left to right, year 1 through the terminal year. You can stack this with a column of data for each year, For example, setting up Year 1 only, below:
Year 1
Delta Revenue
Delta Expenses
Delta Depreciation____________________________
= Year 1 Incremental CF (using the above formula)
You will need to next go to the Cumulative Cash flows. But here you start at Year 0, where you have the negative figure for Initial Investment. (You must get that Initial Investment right to proceed!) So start a new cash flow row beginning with Year 0, then Year 1, etc.
- The Year 0 CF is Initial Investment (negative).
- The Year 1 CF is Year 0 CF + Incremental for Year 1.
- Year 2 CF is Year 1 CF + Incremental for Year 2. And so on.
When you get to the terminal year, add the cumulative plus the Terminal CF.
In yourcapital structure, evaluate the book values and market values for new common stock, bonds, and preferred stock. Assume they are workable for all three types of financing, and you will find the weights from your calculations, thus:
- For Bonds (book value) it is # shares outstanding x Par. For market value, # shares outstanding x market price.
- Similar for Stocks (book and market).
- Similar for Preferred stocks (book and market).
You can assess not only the weight of each type of financing, but also the cost ( in percent) and weighted average (in percent). Use the formula for WACC to add up the cost of debt, common stock, and preferred.
RISK: Risk can set up the Beta in the CAPM. Assume that "10% less risk than an average project" is translatable to Beta for the market as a whole. So then "20% more risk than an average project" is also translatable to Beta for the market as a whole. What would these two Betas be?
RADR is derived from the CAPM from the given data and the surmised figure for Beta (hinted above). So the project's risk-adjusted required return equates to the RADR. For example, use the RADR in the NPV computation.
Would appreciate some help with this please. An explanation to aid in my understanding will be greatly appreciated. Thank you!
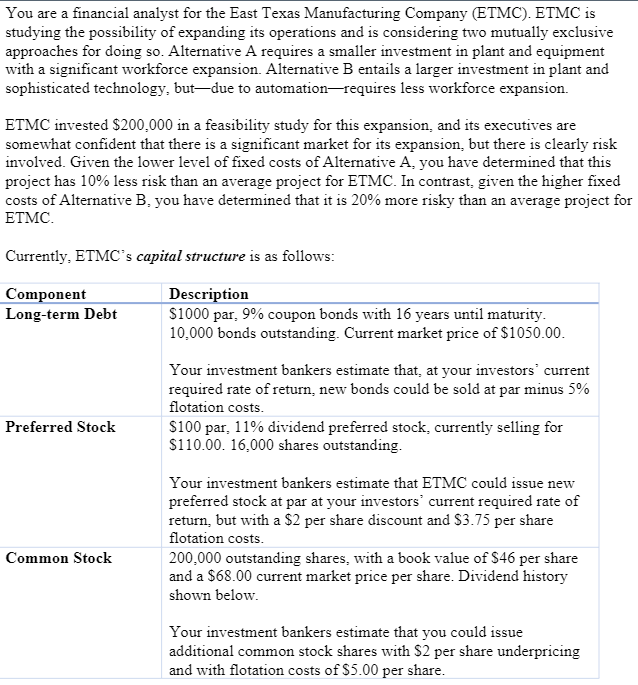
You are a financial analyst for the East Texas Manufacturing Company (ETMC). ETMC is studying the possibility of expanding its operations and is considering two mutually exclusive approaches for doing so. Alternative A requires a smaller investment in plant and equipment with a significant workforce expansion. Alternative B entails a larger investment in plant and sophisticated technology, but-due to automation-requires less workforce expansion. ETMC invested $200,000 in a feasibility study for this expansion, and its executives are somewhat confident that there is a significant market for its expansion, but there is clearly risk involved. Given the lower level of fixed costs of Alternative A, you have determined that this project has 10% less risk than an average project for ETMC. In contrast, given the higher fixed costs of Alternative B, you have determined that it is 20% more risky than an average project for ETMC. Currently, ETMC's capital structure is as follows: Component Long-term Debt Preferred Stock Common Stock Description $1000 par, 9% coupon bonds with 16 years until maturity. 10,000 bonds outstanding. Current market price of $1050.00. Your investment bankers estimate that, at your investors' current required rate of return, new bonds could be sold at par minus 5% flotation costs. $100 par, 11% dividend preferred stock, currently selling for $110.00. 16,000 shares outstanding. Your investment bankers estimate that ETMC could issue new preferred stock at par at your investors' current required rate of return, but with a $2 per share discount and $3.75 per share flotation costs. 200,000 outstanding shares, with a book value of $46 per share and a $68.00 current market price per share. Dividend history shown below. Your investment bankers estimate that you could issue additional common stock shares with $2 per share underpricing and with flotation costs of $5.00 per share.
Step by Step Solution
There are 3 Steps involved in it

Get step-by-step solutions from verified subject matter experts