

Question: Keep it simple not to much writing but make it good. Thank you god bless you . Is it always possible to draw an accurate
Keep it simple not to much writing but make it good. Thank you god bless you
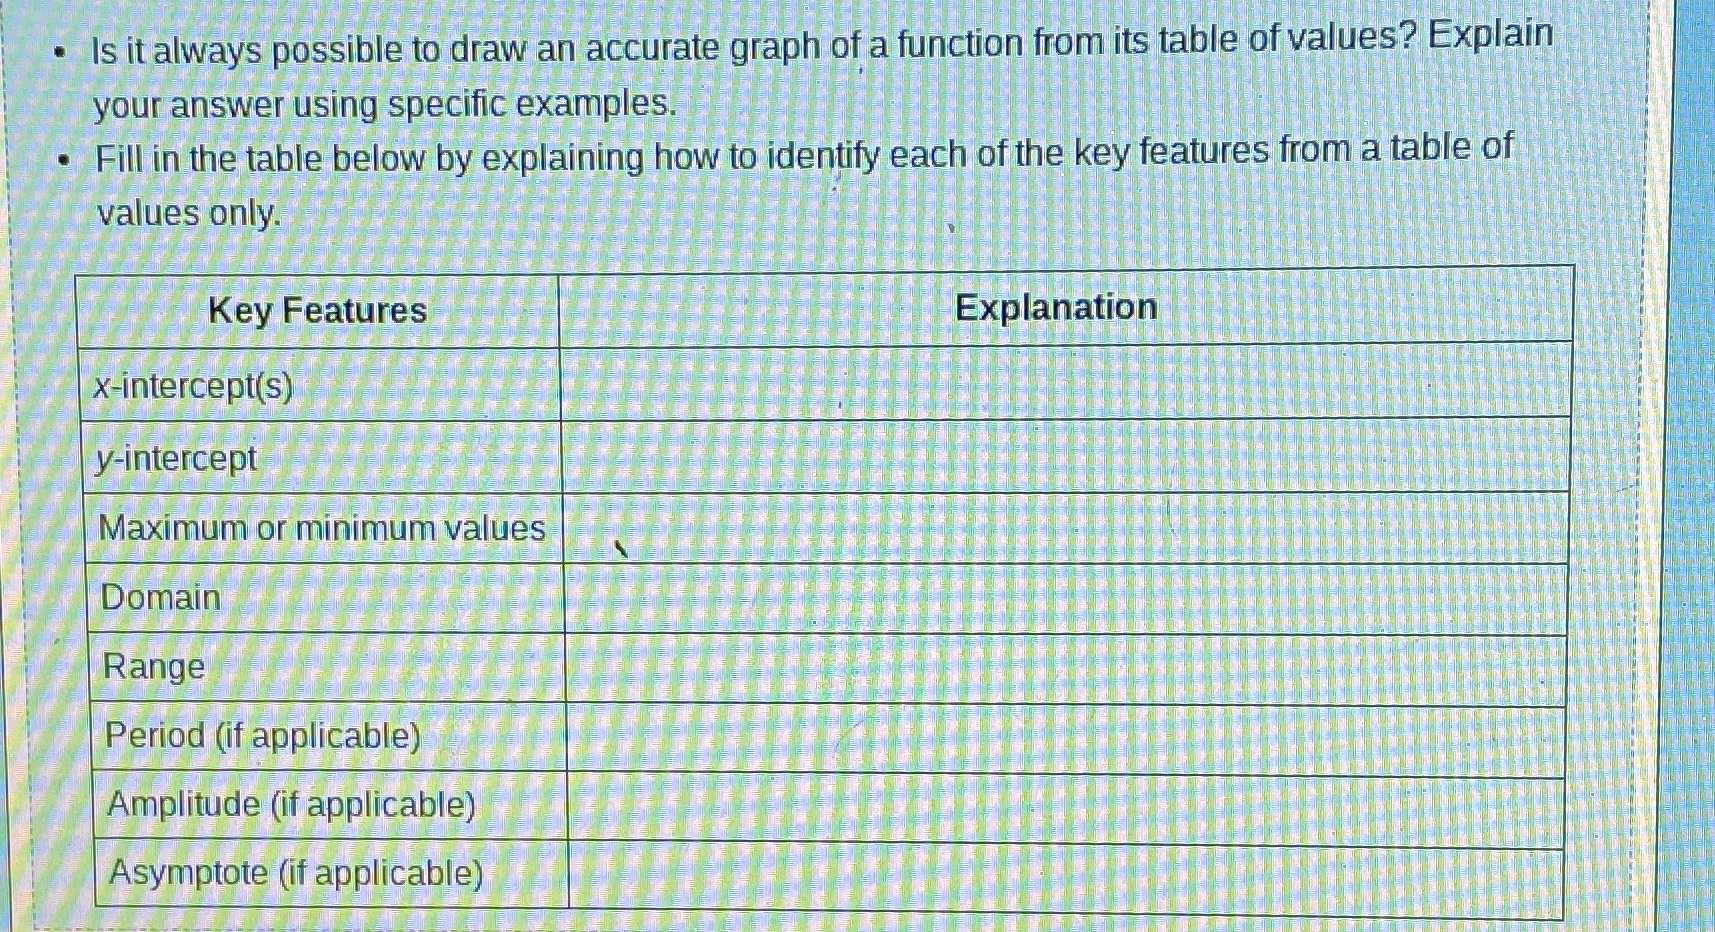
. Is it always possible to draw an accurate graph of a function from its table of values? Explain your answer using specific examples. Fill in the table below by explaining how to identify each of the key features from a table of values only Key Features Explanation x-intercept(s) y-intercept Maximum or minimum values Domain Range Period (if applicable) Amplitude (if applicable) Asymptote (if applicable)
Step by Step Solution
There are 3 Steps involved in it
1 Expert Approved Answer
Step: 1 Unlock

Question Has Been Solved by an Expert!
Get step-by-step solutions from verified subject matter experts
Step: 2 Unlock
Step: 3 Unlock