

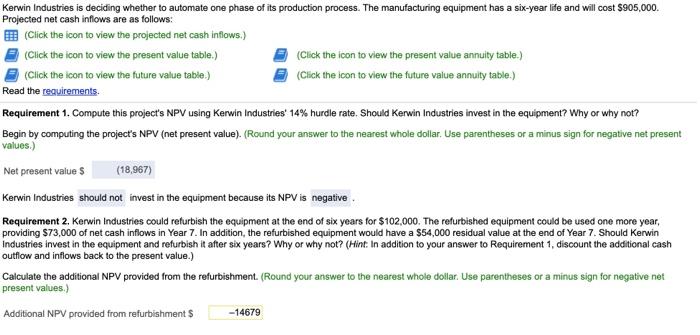
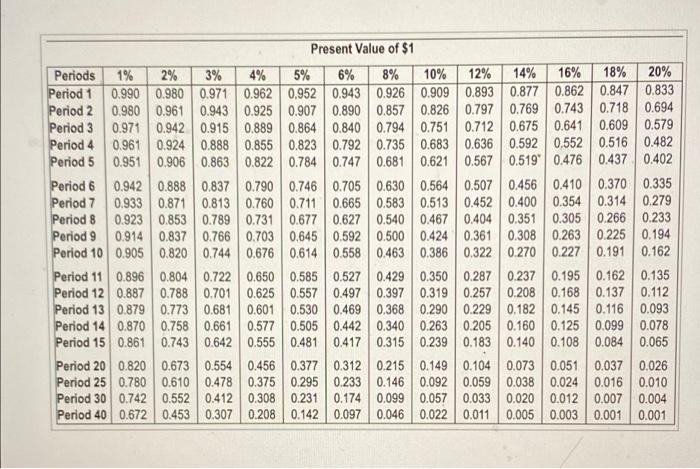
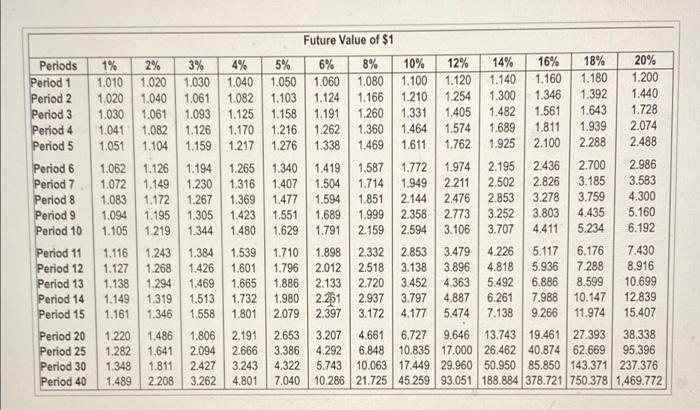
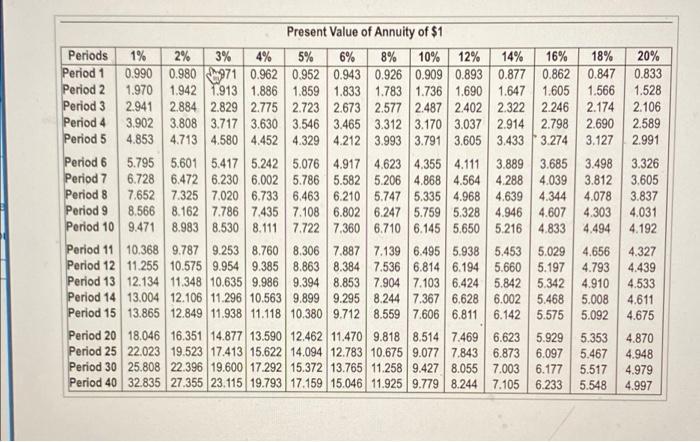
Kerwin Industries is deciding whether to automate one phase of its production process. The manufacturing equipment...
Fantastic news! We've Found the answer you've been seeking!
Question:
Transcribed Image Text:
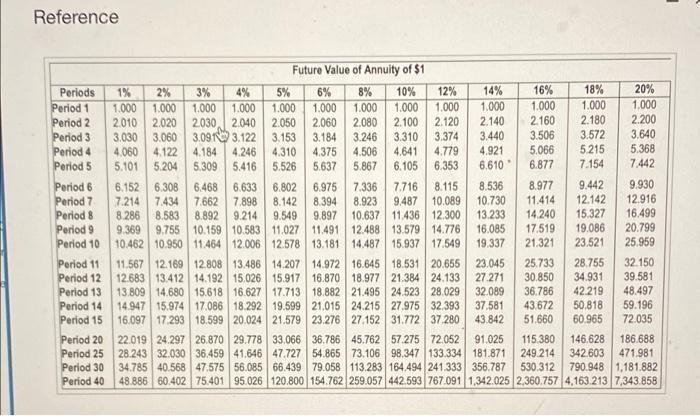
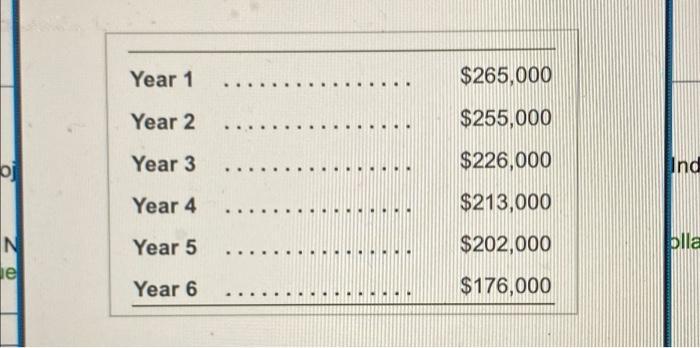
Kerwin Industries is deciding whether to automate one phase of its production process. The manufacturing equipment has a six-year life and will cost $905,000. Projected net cash inflows are as follows: (Click the icon to view the projected net cash inflows.) (Click the icon to view the present value table.) (Click the icon to view the future value table.) Read the requirements. Requirement 1. Compute this project's NPV using Kerwin Industries' 14% hurdle rate. Should Kerwin Industries invest in the equipment? Why or why not? Begin by computing the project's NPV (net present value). (Round your answer to the nearest whole dollar. Use parentheses or a minus sign for negative net present values.) Net present value $ (18,967) Kerwin Industries should not invest in the equipment because its NPV is negative. Requirement 2. Kerwin Industries could refurbish the equipment at the end of six years for $102,000. The refurbished equipment could be used one more year, providing $73,000 of net cash inflows in Year 7. In addition, the refurbished equipment would have a $54,000 residual value at the end of Year 7. Should Kerwin Industries invest in the equipment and refurbish it after six years? Why or why not? (Hint: In addition to your answer to Requirement 1, discount the additional cash outflow and inflows back to the present value.) (Click the icon to view the present value annuity table.) (Click the icon to view the future value annuity table.) Calculate the additional NPV provided from the refurbishment. (Round your answer to the nearest whole dollar. Use parentheses or a minus sign for negative net present values.) Additional NPV provided from refurbishment $ -14679 Periods 1% 0.990 0.980 0.971 Period 1 Period 2 Period 3 Period 4 Period 5 Period 6 Period 7 Period 8 Period 9 Period 10 Present Value of $1 5% 12% 14% 16% 18% 20% 6% 8% 10% 0.952 0.943 0.926 0.909 0.893 0.877 0.862 0.847 0.833 0.907 0.890 0.857 0.826 0.797 0.769 0.743 0.718 0.694 0.942 0.915 0.889 0.864 0.840 0.794 0.906 0.567 0.942 0.751 0.712 0.675 0.641 0.609 0.579 0.924 0.888 0.855 0.823 0.792 0.735 0.683 0.636 0.592 0,552 0.516 0.482 0.863 0.822 0.784 0.747 0.681 0.621 0.519 0.476 0.437 0.402 0.837 0.790 0.746 0.705 0.630 0.564 0.507 0.456 0.410 0.370 0.335 0.813 0.760 0.711 0.665 0.583 0.513 0.452 0.400 0.354 0.314 0.279 0.853 0.789 0.731 0.677 0.627 0.540 0.467 0.404 0.351 0.305 0.266 0.233 0.914 0.837 0.766 0.703 0.645 0.592 0.500 0.424 0.361 0.308 0.263 0.225 0.194 0.270 0.227 0.191 0.162 0.888 0.933 0.871 0.923 0.905 0.820 0.744 0.676 0.614 0.558 0.463 0.386 0.322 0.961 0.951 2% 0.980 0.961 3% 4% 0.971 0.962 0.943 0.925 Period 11 0.896 0.804 0.722 0.650 0.701 Period 12 0.887 0.788 Period 13 0.879 0.773 0.681 0.601 0.530 0.469 0.368 0.290 0.229 Period 14 0.870 0.758 0.661 0.577 0.505 0.442 0.340 0.263 Period 15 0.861 0.743 0.642 0.555 0.481 0.417 0.315 0.239 0.377 0.312 0.215 0.149 0.295 0.233 0.146 0.092 0.059 0.099 0.057 0.033 0.046 0.022 0.231 0.174 0.142 0.097 Period 20 0.820 Period 25 0.780 0.610 Period 30 0.742 0.552 Period 40 0.672 0.453 0.673 0.554 0.478 0.412 0.307 0.585 0.527 0.429 0.350 0.287 0.237 0.195 0.162 0.135 0.625 0.557 0.497 0.397 0.319 0.257 0.208 0.168 0.137 0.182 0.145 0.116 0.112 0.456 0.375 0.308 0.208 0.205 0.160 0.183 0.140 0.125 0.099 0.108 0.084 0.093 0.078 0.065 0.104 0.073 0.051 0.037 0.026 0.038 0.024 0.016 0.010 0.020 0.012 0.007 0.004 0.011 0.005 0.003 0.001 0.001 Periods 1% Period 1 Period 2 Period 3 Period 4 Period 5 Period 6 Period 7 Period 8 Period 9 Period 10 Period 11 Period 12 Period 13 Period 14 Period 15 Period 20 Period 25 Period 30 Period 40 2% 1.010 1.020 1.020 1.040 1.030 1.061 1.093 1.041 1.082 1.126 1.170 1.051 1.104 1.159 1.217 1.062 1.126 1.194 1.265 1.072 1.149 1.230 1.316 1.083 1.172 1.267 1.369 1.094 1.195 1.305 1.105 Future Value of $1 6% 8% 5% 1.050 1.060 1.080 1.103 1.125 1.158 1.191 1,260 1.216 1.262 1.360 1.338 1.276 1.469 3% 4% 1.040 1.030 1.082 1.061 1.116 1.243 1.384 1.127 1.268 1.426 1.138 1.294 1.469 1.149 1.319 1.513 1.161 1.346 1.558 1.220 1.282 1.348 10% 1.100 1.124 1.166 1.210 1.331 1.464 1.340 1.419 1.587 1.772 1.974 2.195 1.407 1.504 1.714 1.949 2.211 2.502 1.477 1.594 1.851 2.144 2.476 1.423 1.551 1.689 1.999 2.358 2.773 3.252 1.219 1.344 1.480 1.629 1.791 2.159 2.594 3.106 3.707 1.539 1.710 1.898 2.332 2.853 3.479 4.226 5.117 1.796 2.012 2.518 3.138 3.896 4.818 5.936 1.886 2.133 2.720 3.452 4.363 5.492 6.886 3.797 4.887 6.261 7.988 4.177 5.474 1.601 1.665 1.732 1.980 2.251 2.937 2.079 2.397 1.801 3.172 12% 14% 16% 18% 1.120 1.140 1.160 1.180 1.254 1.300 1.346 1.392 1.405 1.482 1.561 1.643 1.574 1.689 1.811 1.939 1.611 1.762 1.925 2.100 2.288 2.653 3.207 2.700 2.436 2.826 3.185 2.853 3.278 3.759 3.803 4.435 4.411 5.234 6.176 7.288 8.599 10.147 7.138 9.266 11.974 20% 1.200 1.440 1.728 2.074 2.488 2.986 3.583 4.300 5.160 6.192 7.430 8.916 10.699 1.486 1.806 2.191 6.727 9.646 13.743 19.461 27.393 38.338 4.661 6.848 10.835 17.000 26.462 40.874 62.669 4.292 95.396 1.641 2.094 2.666 3.386 1.811 2.427 3.243 4.322 5.743 10.063 17.449 29.960 50.950 85.850 143.371 237.376 1.489 2.208 3.262 4.801 7.040 10.286 21.725 45.259 93.051 188.884 378.721 750.378 1,469.772 12.839 15.407 Present Value of Annuity of $1 Periods 1% 2% 3% 4% 5% 6% 8% 10% 12% 14% 16% 18% 20% Period 1 0.990 0.980 971 0.962 0.952 0.943 0.926 0.909 0.893 0.877 0.862 0.847 0.833 Period 2 1.970 1.942 1.913 1.886 1.859 1.833 1.783 1.736 1.690 1.647 1.605 1.566 1.528 Period 3 2.941 2.884 2.829 2.775 2.723 2.673 2.577 2.487 2.402 2.322 2.246 2.174 Period 4 3.902 3.808 3.717 3.630 3.546 3.465 3.312 3.170 3.037 2.914 2.798 2.690 4.853 4.713 4.580 4.452 4.329 4.212 3.993 3.791 3.605 3.433 3.274 3.127 2.106 2.589 Period 5 2.991 5.795 3.326 6.728 3.812 3.605 3.837 4.031 4.192 5.601 5.417 5.242 5.076 4.917 4.623 4.355 4.111 3.889 3.685 3.498 6.472 6.230 6.002 5.786 5.582 5.206 4.868 4.564 4.288 4.039 7.652 7.325 7.020 6.733 6.463 6.210 5.747 5.335 4.968 4.639 4.344 4.078 8.566 8.162 7.786 7.435 7.108 6.802 6.247 5.759 5.328 4.946 4.607 4.303 9.471 8.983 8.530 8.111 7.722 7.360 6.710 6.145 5.650 5.216 4.833 4.494 Period 11 10.368 9.787 9.253 8.760 8.306 7.887 7.139 6.495 5.938 5.453 5.029 4.656 Period 12 11.255 10.575 9.954 9.385 8.863 8.384 7.536 6.814 6.194 5.660 5.197 4.793 Period 13 12.134 11.348 10.635 9.986 9.394 8.853 7.904 7.103 6.424 5.842 5.342 Period 14 13.004 12.106 11.296 10.563 9.899 9.295 8.244 7.367 6.628 6.002 5.468 Period 15 13.865 12.849 11.938 11.118 10.380 9.712 8.559 18.046 16.351 14.877 13.590 12.462 11.470 9.818 8.514 7.469 6.623 5.929 22.023 19.523 17.413 15.622 14.094 12.783 10.675 9.077 7.843 6.873 6.097 5.467 25.808 22.396 19.600 17.292 15.372 13.765 11.258 9.427 8.055 7.003 6.177 5.517 32.835 27.355 23.115 19.793 17.159 15.046 11.925 9.779 8.244 7.105 6.233 5.548 4.997 4.910 5.008 7.606 6.811. 6.142 5.575 5.092 5.353 4.870 4.948 4.979 Period 6 Period 7 Period 8 Period 9 Period 10 Period 20 Period 25 Period 30 Period 40 4.327 4.439 4.533 4.611 4.675 Reference Periods Period 1 Period 2 Period 3 Period 4 Period 5 Period 6 Period 7 Period 8 Period 9 Period 10 Period 11 Period 12 Period 13 Period 14 Period 15 Period 20 Period 25 Period 30 Period 40 Future Value of Annuity of $1 1% 2% 3% 6% 8% 10% 12% 14% 1.000 1.000 1.000 1.000 4% 5% 1.000 1.000 1.000 1.000 1.000 2.040 2.010 2.020 2.030 3.060 3.091 3.122 4.122 4.184 4.246 5.204 3.030 4.060 5.101 5.309 5.416 6.152 6.308 6.468 6.633 7.214 8.286 1.000 2.050 2.060 2.080 2.100 2.120 2,140 3.153 3.184 3.246 3.310 3.374 3.440 4.310 4.375 4.506 4.641 4.779 5.526 5.637 5.867 6.105 6.353 6.802 6.975 7.336 7.716 8.115 8.536 7.434 7.662 7.898 8.142 8.394 8.923 9.487 10.089 10.730 8.583 8.892 9.214 9.549 9.897 10.637 11.436 12.300 13.233 9.369 9,755 10.159 10.583 11.027 11.491 12.488 13.579 14.776 16.085 10.462 10.950 11.464 12.006 12.578 13.181 14.487 15.937 17.549 19.337 11.567 12.169 12.808 13.486 14.207 14.972 16.645 18.531 20.655 12.683 13.412 14.192 15.026 15.917 16.870 18.977 21.384 24.133 13.809 14.680 15.618 16.627 17.713 18.882 21.495 24.523 28.029 14.947 15.974 17.086 18.292 19.599 21.015 24.215 27.975 32.393 16.097 17.293 18.599 20.024 21.579 23.276 27.152 31.772 37.280 22.019 24.297 26.870 29.778 33.066 36.786 45.762 57.275 72.052 91.025 28.243 32.030 36.459 41.646 47.727 54.865 73.106 98.347 133.334 181.871 34.785 40.568 47.575 56.085 66.439 79.058 113.283 164.494 241.333 356.787 48.886 60.402 75.401 95.026 120.800 154.762 259.057 442.593 767.091 1,342.025 2,360.757 4,163.213 7,343.858 48.497 59.196 51.660 60.965 72.035 115.380 146.628 186.688 249.214 342.603 471.981 530.312 790.948 1,181.882 4.921 6.610 16% 1.000 2.160 3.506 5.066 6.877 18% 1.000 2.180 3.572 5.215 7.154 8.977 9.442 11.414 12.142 14.240 15.327 17.519 19.086 21.321 23.521 20% 1.000 2.200 3.640 5.368 7.442 23.045 25.733 27.271 30.850 32.089 36.786 42.219 37.581 43.672 50.818 43.842 9.930 12.916 16.499 20.799 25.959 28.755 32.150 34.931 39.581 oj N e Year 1 Year 2 Year 3 Year 4 Year 5 Year 6 $265,000 $255,000 $226,000 $213,000 $202,000 $176,000 Ind olla Kerwin Industries is deciding whether to automate one phase of its production process. The manufacturing equipment has a six-year life and will cost $905,000. Projected net cash inflows are as follows: (Click the icon to view the projected net cash inflows.) (Click the icon to view the present value table.) (Click the icon to view the future value table.) Read the requirements. Requirement 1. Compute this project's NPV using Kerwin Industries' 14% hurdle rate. Should Kerwin Industries invest in the equipment? Why or why not? Begin by computing the project's NPV (net present value). (Round your answer to the nearest whole dollar. Use parentheses or a minus sign for negative net present values.) Net present value $ (18,967) Kerwin Industries should not invest in the equipment because its NPV is negative. Requirement 2. Kerwin Industries could refurbish the equipment at the end of six years for $102,000. The refurbished equipment could be used one more year, providing $73,000 of net cash inflows in Year 7. In addition, the refurbished equipment would have a $54,000 residual value at the end of Year 7. Should Kerwin Industries invest in the equipment and refurbish it after six years? Why or why not? (Hint: In addition to your answer to Requirement 1, discount the additional cash outflow and inflows back to the present value.) (Click the icon to view the present value annuity table.) (Click the icon to view the future value annuity table.) Calculate the additional NPV provided from the refurbishment. (Round your answer to the nearest whole dollar. Use parentheses or a minus sign for negative net present values.) Additional NPV provided from refurbishment $ -14679 Periods 1% 0.990 0.980 0.971 Period 1 Period 2 Period 3 Period 4 Period 5 Period 6 Period 7 Period 8 Period 9 Period 10 Present Value of $1 5% 12% 14% 16% 18% 20% 6% 8% 10% 0.952 0.943 0.926 0.909 0.893 0.877 0.862 0.847 0.833 0.907 0.890 0.857 0.826 0.797 0.769 0.743 0.718 0.694 0.942 0.915 0.889 0.864 0.840 0.794 0.906 0.567 0.942 0.751 0.712 0.675 0.641 0.609 0.579 0.924 0.888 0.855 0.823 0.792 0.735 0.683 0.636 0.592 0,552 0.516 0.482 0.863 0.822 0.784 0.747 0.681 0.621 0.519 0.476 0.437 0.402 0.837 0.790 0.746 0.705 0.630 0.564 0.507 0.456 0.410 0.370 0.335 0.813 0.760 0.711 0.665 0.583 0.513 0.452 0.400 0.354 0.314 0.279 0.853 0.789 0.731 0.677 0.627 0.540 0.467 0.404 0.351 0.305 0.266 0.233 0.914 0.837 0.766 0.703 0.645 0.592 0.500 0.424 0.361 0.308 0.263 0.225 0.194 0.270 0.227 0.191 0.162 0.888 0.933 0.871 0.923 0.905 0.820 0.744 0.676 0.614 0.558 0.463 0.386 0.322 0.961 0.951 2% 0.980 0.961 3% 4% 0.971 0.962 0.943 0.925 Period 11 0.896 0.804 0.722 0.650 0.701 Period 12 0.887 0.788 Period 13 0.879 0.773 0.681 0.601 0.530 0.469 0.368 0.290 0.229 Period 14 0.870 0.758 0.661 0.577 0.505 0.442 0.340 0.263 Period 15 0.861 0.743 0.642 0.555 0.481 0.417 0.315 0.239 0.377 0.312 0.215 0.149 0.295 0.233 0.146 0.092 0.059 0.099 0.057 0.033 0.046 0.022 0.231 0.174 0.142 0.097 Period 20 0.820 Period 25 0.780 0.610 Period 30 0.742 0.552 Period 40 0.672 0.453 0.673 0.554 0.478 0.412 0.307 0.585 0.527 0.429 0.350 0.287 0.237 0.195 0.162 0.135 0.625 0.557 0.497 0.397 0.319 0.257 0.208 0.168 0.137 0.182 0.145 0.116 0.112 0.456 0.375 0.308 0.208 0.205 0.160 0.183 0.140 0.125 0.099 0.108 0.084 0.093 0.078 0.065 0.104 0.073 0.051 0.037 0.026 0.038 0.024 0.016 0.010 0.020 0.012 0.007 0.004 0.011 0.005 0.003 0.001 0.001 Periods 1% Period 1 Period 2 Period 3 Period 4 Period 5 Period 6 Period 7 Period 8 Period 9 Period 10 Period 11 Period 12 Period 13 Period 14 Period 15 Period 20 Period 25 Period 30 Period 40 2% 1.010 1.020 1.020 1.040 1.030 1.061 1.093 1.041 1.082 1.126 1.170 1.051 1.104 1.159 1.217 1.062 1.126 1.194 1.265 1.072 1.149 1.230 1.316 1.083 1.172 1.267 1.369 1.094 1.195 1.305 1.105 Future Value of $1 6% 8% 5% 1.050 1.060 1.080 1.103 1.125 1.158 1.191 1,260 1.216 1.262 1.360 1.338 1.276 1.469 3% 4% 1.040 1.030 1.082 1.061 1.116 1.243 1.384 1.127 1.268 1.426 1.138 1.294 1.469 1.149 1.319 1.513 1.161 1.346 1.558 1.220 1.282 1.348 10% 1.100 1.124 1.166 1.210 1.331 1.464 1.340 1.419 1.587 1.772 1.974 2.195 1.407 1.504 1.714 1.949 2.211 2.502 1.477 1.594 1.851 2.144 2.476 1.423 1.551 1.689 1.999 2.358 2.773 3.252 1.219 1.344 1.480 1.629 1.791 2.159 2.594 3.106 3.707 1.539 1.710 1.898 2.332 2.853 3.479 4.226 5.117 1.796 2.012 2.518 3.138 3.896 4.818 5.936 1.886 2.133 2.720 3.452 4.363 5.492 6.886 3.797 4.887 6.261 7.988 4.177 5.474 1.601 1.665 1.732 1.980 2.251 2.937 2.079 2.397 1.801 3.172 12% 14% 16% 18% 1.120 1.140 1.160 1.180 1.254 1.300 1.346 1.392 1.405 1.482 1.561 1.643 1.574 1.689 1.811 1.939 1.611 1.762 1.925 2.100 2.288 2.653 3.207 2.700 2.436 2.826 3.185 2.853 3.278 3.759 3.803 4.435 4.411 5.234 6.176 7.288 8.599 10.147 7.138 9.266 11.974 20% 1.200 1.440 1.728 2.074 2.488 2.986 3.583 4.300 5.160 6.192 7.430 8.916 10.699 1.486 1.806 2.191 6.727 9.646 13.743 19.461 27.393 38.338 4.661 6.848 10.835 17.000 26.462 40.874 62.669 4.292 95.396 1.641 2.094 2.666 3.386 1.811 2.427 3.243 4.322 5.743 10.063 17.449 29.960 50.950 85.850 143.371 237.376 1.489 2.208 3.262 4.801 7.040 10.286 21.725 45.259 93.051 188.884 378.721 750.378 1,469.772 12.839 15.407 Present Value of Annuity of $1 Periods 1% 2% 3% 4% 5% 6% 8% 10% 12% 14% 16% 18% 20% Period 1 0.990 0.980 971 0.962 0.952 0.943 0.926 0.909 0.893 0.877 0.862 0.847 0.833 Period 2 1.970 1.942 1.913 1.886 1.859 1.833 1.783 1.736 1.690 1.647 1.605 1.566 1.528 Period 3 2.941 2.884 2.829 2.775 2.723 2.673 2.577 2.487 2.402 2.322 2.246 2.174 Period 4 3.902 3.808 3.717 3.630 3.546 3.465 3.312 3.170 3.037 2.914 2.798 2.690 4.853 4.713 4.580 4.452 4.329 4.212 3.993 3.791 3.605 3.433 3.274 3.127 2.106 2.589 Period 5 2.991 5.795 3.326 6.728 3.812 3.605 3.837 4.031 4.192 5.601 5.417 5.242 5.076 4.917 4.623 4.355 4.111 3.889 3.685 3.498 6.472 6.230 6.002 5.786 5.582 5.206 4.868 4.564 4.288 4.039 7.652 7.325 7.020 6.733 6.463 6.210 5.747 5.335 4.968 4.639 4.344 4.078 8.566 8.162 7.786 7.435 7.108 6.802 6.247 5.759 5.328 4.946 4.607 4.303 9.471 8.983 8.530 8.111 7.722 7.360 6.710 6.145 5.650 5.216 4.833 4.494 Period 11 10.368 9.787 9.253 8.760 8.306 7.887 7.139 6.495 5.938 5.453 5.029 4.656 Period 12 11.255 10.575 9.954 9.385 8.863 8.384 7.536 6.814 6.194 5.660 5.197 4.793 Period 13 12.134 11.348 10.635 9.986 9.394 8.853 7.904 7.103 6.424 5.842 5.342 Period 14 13.004 12.106 11.296 10.563 9.899 9.295 8.244 7.367 6.628 6.002 5.468 Period 15 13.865 12.849 11.938 11.118 10.380 9.712 8.559 18.046 16.351 14.877 13.590 12.462 11.470 9.818 8.514 7.469 6.623 5.929 22.023 19.523 17.413 15.622 14.094 12.783 10.675 9.077 7.843 6.873 6.097 5.467 25.808 22.396 19.600 17.292 15.372 13.765 11.258 9.427 8.055 7.003 6.177 5.517 32.835 27.355 23.115 19.793 17.159 15.046 11.925 9.779 8.244 7.105 6.233 5.548 4.997 4.910 5.008 7.606 6.811. 6.142 5.575 5.092 5.353 4.870 4.948 4.979 Period 6 Period 7 Period 8 Period 9 Period 10 Period 20 Period 25 Period 30 Period 40 4.327 4.439 4.533 4.611 4.675 Reference Periods Period 1 Period 2 Period 3 Period 4 Period 5 Period 6 Period 7 Period 8 Period 9 Period 10 Period 11 Period 12 Period 13 Period 14 Period 15 Period 20 Period 25 Period 30 Period 40 Future Value of Annuity of $1 1% 2% 3% 6% 8% 10% 12% 14% 1.000 1.000 1.000 1.000 4% 5% 1.000 1.000 1.000 1.000 1.000 2.040 2.010 2.020 2.030 3.060 3.091 3.122 4.122 4.184 4.246 5.204 3.030 4.060 5.101 5.309 5.416 6.152 6.308 6.468 6.633 7.214 8.286 1.000 2.050 2.060 2.080 2.100 2.120 2,140 3.153 3.184 3.246 3.310 3.374 3.440 4.310 4.375 4.506 4.641 4.779 5.526 5.637 5.867 6.105 6.353 6.802 6.975 7.336 7.716 8.115 8.536 7.434 7.662 7.898 8.142 8.394 8.923 9.487 10.089 10.730 8.583 8.892 9.214 9.549 9.897 10.637 11.436 12.300 13.233 9.369 9,755 10.159 10.583 11.027 11.491 12.488 13.579 14.776 16.085 10.462 10.950 11.464 12.006 12.578 13.181 14.487 15.937 17.549 19.337 11.567 12.169 12.808 13.486 14.207 14.972 16.645 18.531 20.655 12.683 13.412 14.192 15.026 15.917 16.870 18.977 21.384 24.133 13.809 14.680 15.618 16.627 17.713 18.882 21.495 24.523 28.029 14.947 15.974 17.086 18.292 19.599 21.015 24.215 27.975 32.393 16.097 17.293 18.599 20.024 21.579 23.276 27.152 31.772 37.280 22.019 24.297 26.870 29.778 33.066 36.786 45.762 57.275 72.052 91.025 28.243 32.030 36.459 41.646 47.727 54.865 73.106 98.347 133.334 181.871 34.785 40.568 47.575 56.085 66.439 79.058 113.283 164.494 241.333 356.787 48.886 60.402 75.401 95.026 120.800 154.762 259.057 442.593 767.091 1,342.025 2,360.757 4,163.213 7,343.858 48.497 59.196 51.660 60.965 72.035 115.380 146.628 186.688 249.214 342.603 471.981 530.312 790.948 1,181.882 4.921 6.610 16% 1.000 2.160 3.506 5.066 6.877 18% 1.000 2.180 3.572 5.215 7.154 8.977 9.442 11.414 12.142 14.240 15.327 17.519 19.086 21.321 23.521 20% 1.000 2.200 3.640 5.368 7.442 23.045 25.733 27.271 30.850 32.089 36.786 42.219 37.581 43.672 50.818 43.842 9.930 12.916 16.499 20.799 25.959 28.755 32.150 34.931 39.581 oj N e Year 1 Year 2 Year 3 Year 4 Year 5 Year 6 $265,000 $255,000 $226,000 $213,000 $202,000 $176,000 Ind olla
Expert Answer:
Answer rating: 100% (QA)
To determine if Kerwin Industries should invest in the equipment and refurbish it after six years w... View the full answer

Related Book For 
Posted Date:
Students also viewed these accounting questions
-
Kerwin Industries is deciding whether to automate one phase of its production process. The manufacturing equipment has a six- year life and will cost $ 925,000. Projected net cash inflows are as...
-
Sprocket Industries is deciding whether to automate one phase of its production process. The manufacturing equipment has a six-year life and will cost $905,000. Projected net cash inflows are as...
-
Alderman industries is deciding whether to automate one phase of its production process. The manufacturing equipment has a six- year life and will cost $ 915,000. Projected net cash inflows are as...
-
In 2017, Barlow moved from Chicago to Miami to start a new job, incurring costs of $1,200 to move household goods and $2,500 in temporary living expenses. Barlow was not reimbursed for any of these...
-
Indicate whether the following losses are covered under Section II of the homeowners policy. Assume there are no special endorsements. Give reasons for your answers. a. The named insured's dog bites...
-
What is the inverse of a matrix?
-
Figure 20.27 shows the flowsheet for a process for the production of gasoline (mainly octane) from an olefins feed (propane, propene, and butene). The feed to the process is heated in E-100, and then...
-
Wright Cola Corporation produces a new soft drink brand, Sweet Spring, using two production departments: mixing and bottling. Wright's beginning balances and data pertinent to the mixing department's...
-
At 30 June 2022, the share capital of Shire Ltd was comprised of: 1,600,000 ordinary shares issued in 2018 and paid to $2.60 per share less share issue costs of $32,000. 750,000 ordinary shares...
-
Drago Company produces a line of brass-based products, one of which is a flow control valve (for regulating the flow of water). The production of this valve requires the use of specialized equipment...
-
Brainstorm information about yourself that you want to include in your personal branding statement. > What type of position are you seeking? > What makes you qualified for this type of position? 2....
-
Sophia operates a large singing school with 22 employees. She receives advance fee payments from students in respect of each course (a course consists of 26 lessons). If a student does not attend all...
-
You are planning to make monthly deposits of $120 into a retirement account that pays 12 percent interest compounded monthly. If your first deposit will be made one month from now, how large will...
-
Jill Price has an incredible memory. Since she was 15 years old, she can remember everything that she has done and every t.v. show she has watched. What type of memory is special for Jill Price?
-
Daniel is a resident individual who carries on a retail business but does not use the SBE method of accounting for income in his business. On 30 June of the current tax year he had trade debtors of...
-
Describe the classic steps for identifying an endocrine gland. Are these steps practical for identifying the sources of all the hormones we know of today? Explain.
-
Conventions in art are a habitual or generally accepted way of thinking in a given culture. Seeing art in only one facet. O True False
-
Read the Forecasting Supply Chain Demand Starbucks Corporation case in your text Operations and Supply Chain Management on pages 484-485, then address the four questions associated with the...
-
Russell Furniture manufactures computer desks in its Westlake, Ohio, plant. The company uses activity- based costing to allocate all manufacturing conversion costs (direct labor and manufacturing...
-
Refer to the Sunburst Sports Data Set. Compute each division's residual income. Interpret your results. Are your results consistent with each division's ROI? Sunburst Sports Data Set. Sunburst Sports...
-
Comparative financial statement data of Banfield, Inc., follow: 1. Market price of Banfields common stock: $ 49.50 at December 31, 2014, and $ 27.02 at December 31, 2013 2. Common shares outstanding:...
-
Theory is the foundation upon which the house of practice is built. How would you interpret this statement and relate it to social entrepreneurship?
-
What is Kinvolved? What customer problem does it solve? What success have you had so far?
-
Which opportunity recognition tool discussed in this chapter resonates most for you, and why?

Study smarter with the SolutionInn App