

Question: Key comparative figures for Apple and Google follow. Apple $ millions Current Year Net sales Cost of sales $ 394,328 223,546 Prior Year $
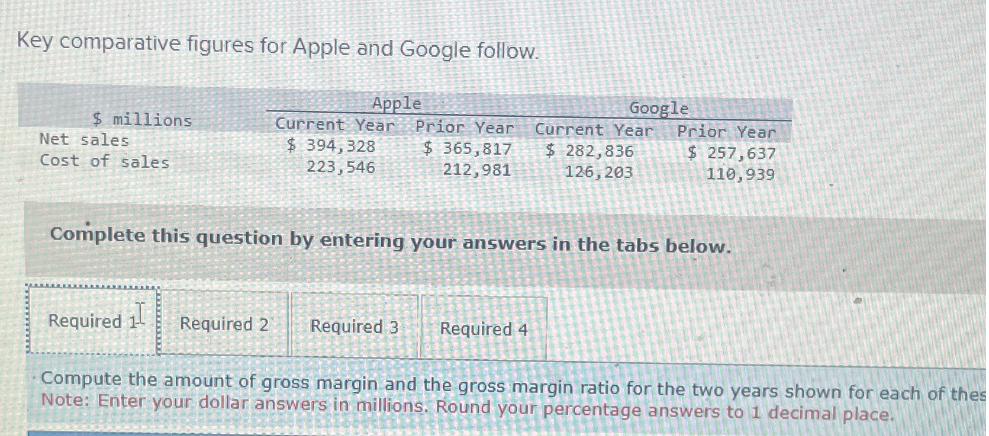
Key comparative figures for Apple and Google follow. Apple $ millions Current Year Net sales Cost of sales $ 394,328 223,546 Prior Year $ 365,817 212,981 Google Current Year Prior Year $ 282,836 $ 257,637 126,203 110,939 Complete this question by entering your answers in the tabs below. Required 1 Required 2 Required 3 Required 4 Compute the amount of gross margin and the gross margin ratio for the two years shown for each of thes Note: Enter your dollar answers in millions. Round your percentage answers to 1 decimal place.
Step by Step Solution
There are 3 Steps involved in it
To calculate the gross margin and the gross margin ratio for each company and ye... View full answer

Get step-by-step solutions from verified subject matter experts