

Question: Key comparative figures for Apple and Google follow. $ millions Total liabilities Total assets Apple Current Year Prior Year $ 248,028 $ 258,578 338,516 365,725
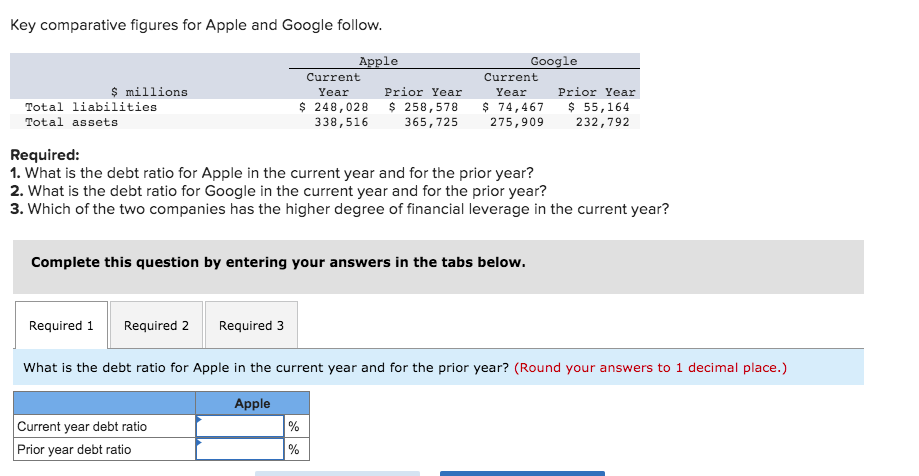
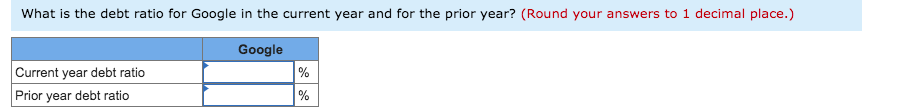

Key comparative figures for Apple and Google follow. $ millions Total liabilities Total assets Apple Current Year Prior Year $ 248,028 $ 258,578 338,516 365,725 Google Current Year Prior Year $ 74,467 $ 55,164 275,909 232,792 Required: 1. What is the debt ratio for Apple in the current year and for the prior year? 2. What is the debt ratio for Google in the current year and for the prior year? 3. Which of the two companies has the higher degree of financial leverage in the current year? Complete this question by entering your answers in the tabs below. Required 1 Required 2 Required 3 What is the debt ratio for Apple in the current year and for the prior year? (Round your answers to 1 decimal place.) Apple Current year debt ratio Prior year debt ratio % % What is the debt ratio for Google in the current year and for the prior year? (Round your answers to 1 decimal place.) Google Current year debt ratio Prior year debt ratio % % Which of the two companies has the higher degree of financial leverage in the current year? Which of the two companies has the higher degree of financial leverage in the current year
Step by Step Solution
There are 3 Steps involved in it

Get step-by-step solutions from verified subject matter experts