

Question: (kinda blurry so i typed it too) here are summary statistics for randomly selected weight of newborn girls and equals 186, X equals 30.2 HG,
(kinda blurry so i typed it too) here are summary statistics for randomly selected weight of newborn girls and equals 186, X equals 30.2 HG, S equals 7.3 HG. Construct a confidence interval estimate of the mean. Using 95% confidence level. Are these results very different from the confidence interval 28.6 HG
what is the confidence interval for the population mean?
are the results between the two confidence intervals very different? 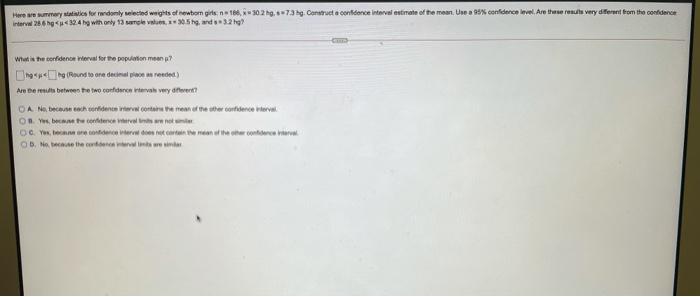
a Here we werden wieder weights of testom its 18.30.2 g. *-73g. Constructe confidence interval estimate of the mean. Ute 95% confidence level. Are the reverydfort from the confidence interw 25624 with only 13 305h, and 327 What is the confidence Werval for the population map? * Pound to one del rended) Are there between the two confidence intervals y ahore O Nobec och riderscore men of meer confidence tera Obecome one who is now De wooneenhetence OD. Note the corner
Step by Step Solution
There are 3 Steps involved in it
1 Expert Approved Answer
Step: 1 Unlock

Question Has Been Solved by an Expert!
Get step-by-step solutions from verified subject matter experts
Step: 2 Unlock
Step: 3 Unlock