

Question: Kindly assist in comprehensive data analysis ( including plots and graphs ) in python that tries to meet objectives to develop and demonstrate a predictive
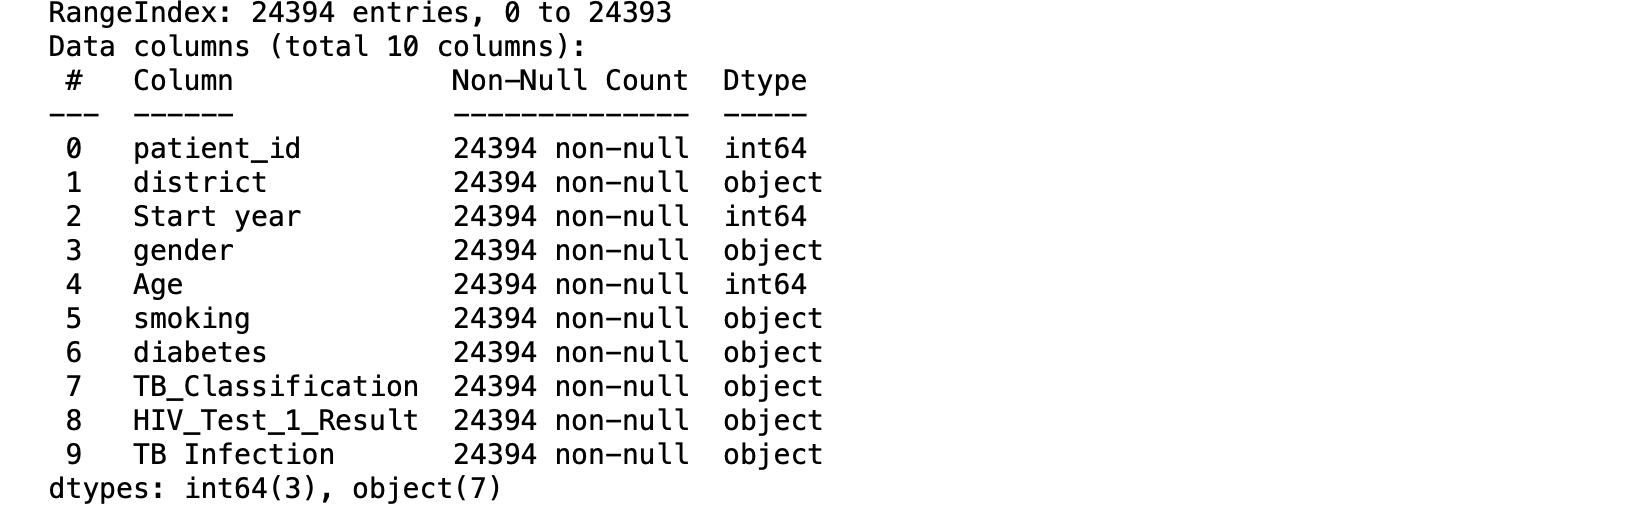
Kindly assist in comprehensive data analysisincluding plots and graphs in python that tries to meet objectives to develop and demonstrate a predictive model using machine learning techniques that identifies individuals at higher risk of TB infection and quantify and compare the stability of machine learning models across different districtsgeographic regions and explore consistency of identified risk factors contributing to the models. Using Supervised learning classification algorithms like logistic regression, decision trees, SVM feature selection, crossvalidation as well as model evaluation eg performance metrics like accuracy, precision, recall statistical tests for comparing models and identifying consistent risk factors. with dataset containing the following features;
Step by Step Solution
There are 3 Steps involved in it
1 Expert Approved Answer
Step: 1 Unlock

Question Has Been Solved by an Expert!
Get step-by-step solutions from verified subject matter experts
Step: 2 Unlock
Step: 3 Unlock