

Question: .... Kindly be simple with explanations 11-96. Show that. for the simple linear regression model, the (c) Test the hypothesis /,:B,, =0 versus Wip. *
.... Kindly be simple with explanations
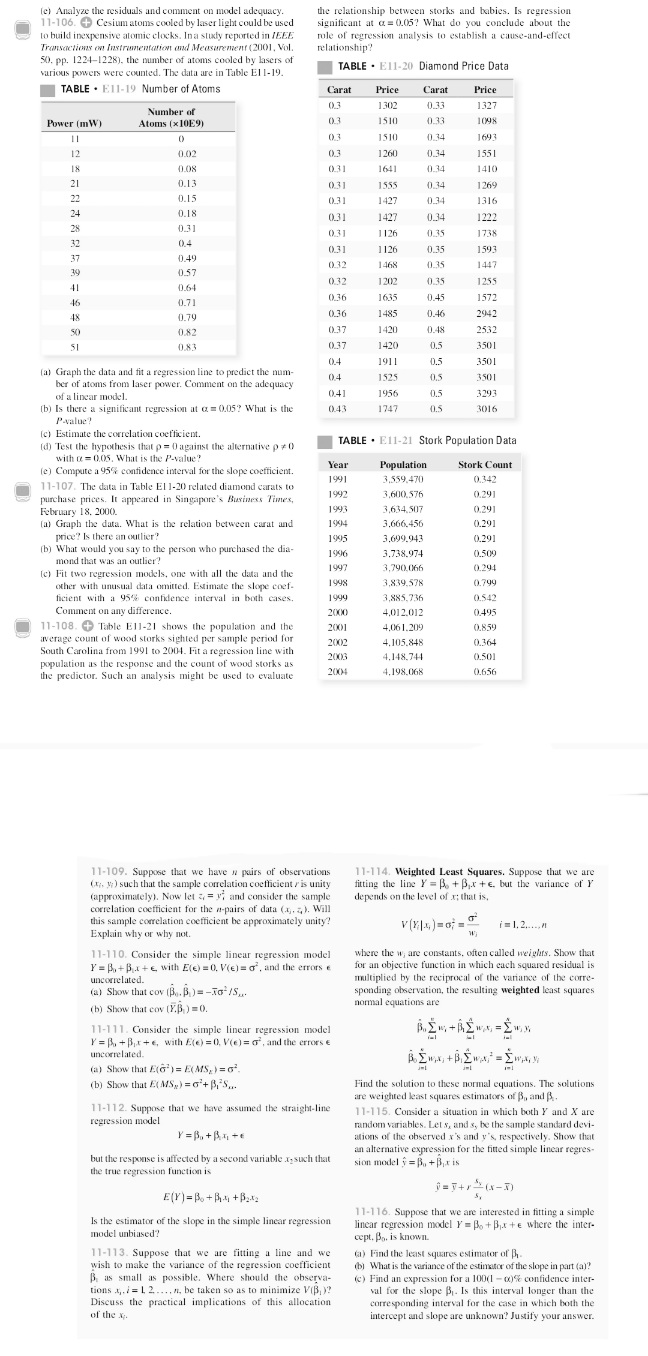
11-96. Show that. for the simple linear regression model, the (c) Test the hypothesis /,:B,, =0 versus Wip. * 0 using following statements are true: o = 0.05. What conclusions can you draw? () E(y, -y.)=0 () E(y -3,)x, =0 11-98. + The strength of paper used in the manufacture of cardboard boxes (y) is related to the percentage of hardwood concentration in the original pulp (x). Under controlled can- ditions, a pilot plant manufactures 16 samples, each from a different batch of pulp. and measures the tensile strength. The 11-97. + An article in the IEEE Transactions on Insuremen- bla follow; tation and Measurement [ "Direct. Fast, and Accurate Measure- ment of V, and & of MOS Transistor Using V,-Sift Circuit" 101.4 1174 117.1 106.2 (1991. Vol. 40, pp. 951-955)] described the use of a simple 1.0 1.5 1.5 linear regression model to express drain current y (in milliam- peres) as a function of ground-to-source voltage x (in volts). 131.9 146.9 146.8 133.9 The data are as follows: 30 2.1 2.2 24 X 1110 1234 125,1 145,2 0,734 1.1 1.50 1.6 2.5 2.8 2.8 0,886 1.2 1.66 1.7 1.04 1.3 1.81 1.8 134.3 144. 143.7 146.9 1. 19 1.97 1.9 3.0 3.0 3.2 3.3 1.35 1.5 2.12 2.0 (a) Fit a simple linear regression model to the data. (a) Draw a scatter diagram of these data. Does a straight-line (b) Test for significance of regression using a = 0.05. relationship seem plausible? (c) Construct a 90 confidence interval on the slope P, (b) Fit a simple linear regression model to these data. (d) Construct a 90% confidence interval on the intercept Po. (c) Test for significance of regression using o = 0.05. What is c) Construct a 95% confidence interval on the mean strength the P-value for this test? at x = 25. [d) Find a 95% confidence interval estimate on the slope. () Analyze the residuals and comment on model adequacy. 11-99. Consider the following data. Suppose that the relation- TABLE . E11-18 Ozone Level Data ship between Yand ris hypothesized to be Y =(R. + Buster. Fit an appropriate model to the data. Does the assumed model Year Days Index Year Days Index form seem reasonable? 1976 91 167 1984 81 18.0 15 18 12 9 I1 1977 105 17.1 1985 65 17.2 0.1 0.13 0.09 0.15 0.20 0.21 0.18 0.24 978 106 18.2 1986 61 169 1970 108 18.1 1987 17.1 11-100. + The data in Table El 1-17 adapted from Montgomery. 1980 17.2 1988 61 Peck, and Vining (2012). present the number of certified mental 88 18.2 defectives per 10,000 of estimated population in the United King- 1981 41 18.2 1989 43 17.3 dom (v') and the number of radio receiver licenses issued (.) by the 1982 $8 160 1990 33 17.5 BBC (in millions) for the years 1924 1983 172 1991 76 16.6 TABLE . E11-17 Data for Correlation Analysis (a) Construct a scatter diagram of the data. Year Year (by Fit a simple linear repression model. 1924 1.350 1931 16 4.620 (c) Test for significance of regression. Calculate R' for the model. 1925 1.960 1932 18 5.497 (d) Analyze the residuals and comment on model adequacy. 1926 2.2 74 1933 19 6260 11-104. Two different methods can be used for measuring 1927 2.483 1934 20 7.012 the temperature of the solution in a Hall cell used in aluminum 1928 I 2.730 193. 21 7.618 smelting. a thermocouple implanted in the cell and an indirect 3091 1930 22 measurement produced from an IR device. The indirect method 8.131 is preferable because the thermocouples are eventually destroyed 1930 17 3.674 1937 8 593 by the solution. Consider the following 10 measurements: Thermocouple 921 935 916 920 940 through 1937. Fit a regression model relating y and &. Com- ment on the model. Specifically, does the existence of a strong 918 924 921 945 correlation imply a cause-and-effect relationship? 11-101. Consider the weight and blood pressure data in Thermocouple 936 925 940 933 927 Exercise 1 1-82. Fit a no-intercept model to the data. and com- IR 930) 919 943 932 935 pare it to the model obtained in Exercise 1 1-82. Which model is superior? (a) Construct a scatter diagram for these data, letting a = there 11-102. An article in Air and Waste ["Update on Ozone mocouple measurement and y = IR measurement. Trends in California's South Coast Air Basin" (1993. Vol. 43)] (b) Fit a simple linear regression model. reported on a study of the ozone levels on the South Coast (c) Test for significance a regression and calculate R". What air basin of California for the years 1976-1991. The author conclusions can you draw? believes that the number of days that the ozone level exceeds (d) Is there evidence to support a claim that both devices pro- 0.20 parts per million depends on the seasonal meteorologi duce equivalent temperature measurements? Formulate cal index (the seasonal average 850 millibar temperature). The and test an appropriate hypothesis to support this claim data are in Table El 1-18: (e) Analyze the residuals and comment on model adequacy a) Construct a scatter diagram of the data. 11-105. The grams of solids removed from a material (y) by Fit a simple linear regression model to the data. Test for is thought to be related to the drying time. Ten observations significance of regression stained from an experimental study follow: () Find a 95% CI on the slope pi (d) Analyze the residuals and comment on model adequacy. 4.3 1.5 1.8 4.9 4.2 4.8 5.8 62 7.0 7.9 11-103. An article in the Journal of Applied Polymer Science 2.5 3.0 3.5 40 4.5 5.0 5.5 60 6.5 7.0 (1995, Vol. 56, pp. 471-476) reported on a study of the effect (a) Construct a scatter diagram for these data. of the mole ratio of sebacic acid on the intrinsic viscosity of b) Fit a simple linear regression model. copolyesters. The data follow: (cl Test for significance of regression. Mole ratiox 10 09 0.8 0.7 0.6 0.5 0.4 0.3 () Based on these data, what is your estimate of the mean grams of solids removed at 4.25 hours? Find a 95% confi- Viscosity y 0.45 0.20 0.34 0.58 0.70 0.57 0.55 0.44 dence interval on the mean. (c) Analyze the residuals and comment on model adequacy. the relationship between storks and babies. Is regression 11-106. + Cesium atoms cooled by laser light could be used significant at a = 0.05? What do you conclude about the to build inexpensive atomic clocks. In a study reported in lESE role of regression analysis to establish a cause-and-effect Transactions on Instrumentation and Measurement (2001, Vol. relationship? 50. pp. 1224-1228). the number of atoms cooled by lasers of various powers were counted. The data are in Table El 1-19. TABLE . E11-20 Diamond Price Data TABLE . EI1-19 Number of Atoms Carat Price Carat Price 1302 0.33 Number of 1327(c) Analyze the residuals and comment on model adequacy. the relationship between storks and babies. Is regression 11-106. + Cesium atoms cooled by laser light could be used significant at a = 0.05? What do you conclude about the to build inexpensive atomic clocks. In a study reported in IEEE mole of regression analysis to establish a cause-and-effect Transactions on instrumentation and Measurement (2001. Vol. relationship? 50. pp. 1224-1228). the number of atoms cooled by lasers of various powers were counted. The data are in Table El 1-19. TABLE . E1 1-20 Diamond Price Data TABLE . ElI-19 Number of Atoms Carat Price Cara Price 130 0_33 1327 Number of Power (mW) Atoms (x 10E9) 03 1510 03 1098 1I 03 1510 1.34 1693 12 0.02 0.3 1260 0 34 1551 18 0.08 031 1641 0.34 1410 21 0.13 0.31 1555 134 1269 22 0.15 031 1427 D_34 1316 24 0.18 031 1427 0.34 1222 0.3] 0.31 1126 1738 0.4 0.31 1 126 0.35 1593 0.49 0.32 1468 135 1447 0.57 1202 7.35 0.64 0.32 1255 0.71 0.36 1635 0.45 1572 0.79 0.36 1485 D.46 2942 0.82 0.37 1 420 0.48 2532 0183 0.37 1420 0.5 3501 0.4 1911 0.5 3501 (a) Graph the data and fit a regression line to predict the num- 04 1525 0.5 3501 ber of atoms from laser power. Comment on the adequacy of a linear model. 041 1956 0.5 3293 (b) Is there a significant regression at c = 0.05? What is the 0.43 1747 3016 P.value? (c) Estimate the correlation coefficient. (d) Test the hypothesis that p = 0 against the alternative p # 0 TABLE . E11-21 Stork Population Data with r = 0.05, What is the P-value? (e) Compute a 95% confidence interval for the slope coefficient. Year Population Stork Count 1991 3.559.470 0.342 11-107. The data in Table El 1-20 related diamond carats to purchase prices. It appeared in Singapore's Business Times, 1992 3.600.576 )291 February 18. 2000. 1993 3.634.507 0.291 (al Graph the data. What is the relation between carat and 1994 3.666.456 ).291 price? Is there an outlier? 1995 3.699.943 0.291 bj What would you say to the person who purchased the dia- 1996 3.738.974 0.509 mond that was an outlier? 1997 3,790.066 ).294 (c) Fit two regression models, one with all the data and the other with unusual data omitted. Estimate the slope coef- 1998 3.839.578 0.794 ficient with a 95% confidence interval in both cases. 1999 3,885.736 0.542 Comment on any difference. 2000 4.012.012 0.495 11-108. + Table E1 1-21 shows the population and the 2001 4.061.209 0.859 iverage count of wood storks sighted per sample period for 2002 4.105.848 0.364 South Carolina from 1991 to 2004. Fit a regression line with 2003 4.148.744 0.501 population as the response and the count of wood storks as the predictor. Such an analysis might be used to evaluate 200 4,198.068 0.656 11-109. Suppose that we have n pairs of observations 11-114. Weighted Least Squares. Suppose that we are (1, #:) such that the sample correlation coefficient / is unity fitting the line Y = B. + Bjr + e. but the variance of Y (approximately). Now let &, = 3, and consider the sample depends on the level of x; that is, correlation coefficient for the a-pairs of data (a . z ). Will this sample correlation coefficient be approximately unity? V(Y)=0 = i = 1.2...... Explain why or why not. 11-110. Consider the simple linear regression model where the w, are constants. often called weights. Show that Y' = P, + B. + e, with E(
Step by Step Solution
There are 3 Steps involved in it

Get step-by-step solutions from verified subject matter experts