

Question: kindly give me a proper solution Following Table 1 shows the frequency distribution for the number of minutes per week spent watching TV by junior
kindly give me a proper solution
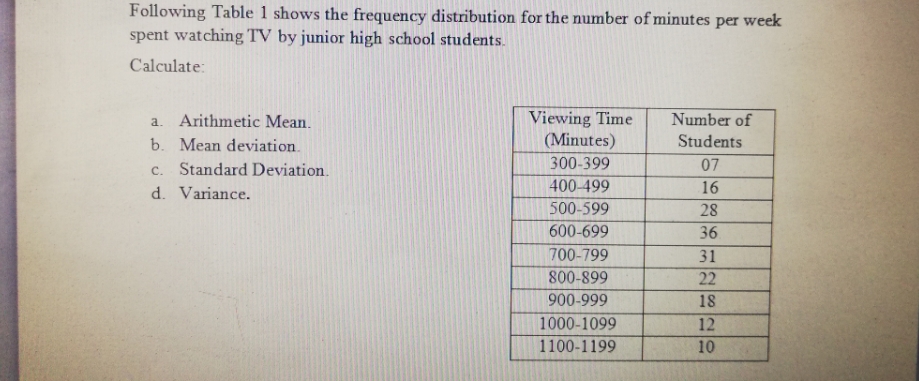
Following Table 1 shows the frequency distribution for the number of minutes per week spent watching TV by junior high school students. Calculate: a. Arithmetic Mean. Viewing Time Number of b. Mean deviation. (Minutes) Students c. Standard Deviation. 300-399 07 400-499 16 d. Variance. 500-599 28 600-699 36 700-799 31 800-899 22 900-999 18 1000-1099 12 1100-1199 10
Step by Step Solution
There are 3 Steps involved in it
1 Expert Approved Answer
Step: 1 Unlock

Question Has Been Solved by an Expert!
Get step-by-step solutions from verified subject matter experts
Step: 2 Unlock
Step: 3 Unlock